false
2022
FY
SKECHERS USA INC
0001065837
--12-31
0.0290
0.0341
P30D
0.0341
0.0290
P3Y
0001065837
2022-01-01
2022-12-31
xbrli:shares
0001065837
us-gaap:CommonClassAMember
2023-02-15
0001065837
us-gaap:CommonClassBMember
2023-02-15
iso4217:USD
0001065837
2022-06-30
0001065837
2022-12-31
0001065837
2021-12-31
0001065837
us-gaap:CommonClassAMember
2022-12-31
0001065837
us-gaap:CommonClassAMember
2021-12-31
0001065837
us-gaap:CommonClassBMember
2022-12-31
0001065837
us-gaap:CommonClassBMember
2021-12-31
0001065837
us-gaap:VariableInterestEntityPrimaryBeneficiaryMember
2022-12-31
0001065837
us-gaap:VariableInterestEntityPrimaryBeneficiaryMember
2021-12-31
iso4217:USD
xbrli:shares
0001065837
2021-01-01
2021-12-31
0001065837
2020-01-01
2020-12-31
0001065837
us-gaap:CommonClassAMember
us-gaap:CommonStockMember
2019-12-31
0001065837
us-gaap:CommonClassBMember
us-gaap:CommonStockMember
2019-12-31
0001065837
us-gaap:AdditionalPaidInCapitalMember
2019-12-31
0001065837
us-gaap:AccumulatedOtherComprehensiveIncomeMember
2019-12-31
0001065837
us-gaap:RetainedEarningsMember
2019-12-31
0001065837
us-gaap:ParentMember
2019-12-31
0001065837
us-gaap:NoncontrollingInterestMember
2019-12-31
0001065837
2019-12-31
0001065837
us-gaap:RetainedEarningsMember
2020-01-01
2020-12-31
0001065837
us-gaap:ParentMember
2020-01-01
2020-12-31
0001065837
us-gaap:NoncontrollingInterestMember
2020-01-01
2020-12-31
0001065837
us-gaap:AccumulatedOtherComprehensiveIncomeMember
2020-01-01
2020-12-31
0001065837
us-gaap:AdditionalPaidInCapitalMember
2020-01-01
2020-12-31
0001065837
us-gaap:CommonClassAMember
us-gaap:CommonStockMember
2020-01-01
2020-12-31
0001065837
us-gaap:CommonClassBMember
us-gaap:CommonStockMember
2020-01-01
2020-12-31
0001065837
us-gaap:CommonClassAMember
us-gaap:CommonStockMember
2020-12-31
0001065837
us-gaap:CommonClassBMember
us-gaap:CommonStockMember
2020-12-31
0001065837
us-gaap:AdditionalPaidInCapitalMember
2020-12-31
0001065837
us-gaap:AccumulatedOtherComprehensiveIncomeMember
2020-12-31
0001065837
us-gaap:RetainedEarningsMember
2020-12-31
0001065837
us-gaap:ParentMember
2020-12-31
0001065837
us-gaap:NoncontrollingInterestMember
2020-12-31
0001065837
2020-12-31
0001065837
us-gaap:RetainedEarningsMember
2021-01-01
2021-12-31
0001065837
us-gaap:ParentMember
2021-01-01
2021-12-31
0001065837
us-gaap:NoncontrollingInterestMember
2021-01-01
2021-12-31
0001065837
us-gaap:AccumulatedOtherComprehensiveIncomeMember
2021-01-01
2021-12-31
0001065837
us-gaap:AdditionalPaidInCapitalMember
2021-01-01
2021-12-31
0001065837
us-gaap:CommonClassAMember
us-gaap:CommonStockMember
2021-01-01
2021-12-31
0001065837
us-gaap:CommonClassBMember
us-gaap:CommonStockMember
2021-01-01
2021-12-31
0001065837
us-gaap:CommonClassAMember
us-gaap:CommonStockMember
2021-12-31
0001065837
us-gaap:CommonClassBMember
us-gaap:CommonStockMember
2021-12-31
0001065837
us-gaap:AdditionalPaidInCapitalMember
2021-12-31
0001065837
us-gaap:AccumulatedOtherComprehensiveIncomeMember
2021-12-31
0001065837
us-gaap:RetainedEarningsMember
2021-12-31
0001065837
us-gaap:ParentMember
2021-12-31
0001065837
us-gaap:NoncontrollingInterestMember
2021-12-31
0001065837
us-gaap:RetainedEarningsMember
2022-01-01
2022-12-31
0001065837
us-gaap:ParentMember
2022-01-01
2022-12-31
0001065837
us-gaap:NoncontrollingInterestMember
2022-01-01
2022-12-31
0001065837
us-gaap:AccumulatedOtherComprehensiveIncomeMember
2022-01-01
2022-12-31
0001065837
us-gaap:AdditionalPaidInCapitalMember
2022-01-01
2022-12-31
0001065837
us-gaap:CommonClassAMember
us-gaap:CommonStockMember
2022-01-01
2022-12-31
0001065837
us-gaap:CommonClassBMember
us-gaap:CommonStockMember
2022-01-01
2022-12-31
0001065837
us-gaap:CommonClassAMember
us-gaap:CommonStockMember
2022-12-31
0001065837
us-gaap:CommonClassBMember
us-gaap:CommonStockMember
2022-12-31
0001065837
us-gaap:AdditionalPaidInCapitalMember
2022-12-31
0001065837
us-gaap:AccumulatedOtherComprehensiveIncomeMember
2022-12-31
0001065837
us-gaap:RetainedEarningsMember
2022-12-31
0001065837
us-gaap:ParentMember
2022-12-31
0001065837
us-gaap:NoncontrollingInterestMember
2022-12-31
0001065837
srt:MinimumMember
us-gaap:BuildingMember
2022-01-01
2022-12-31
0001065837
us-gaap:BuildingMember
srt:MaximumMember
2022-01-01
2022-12-31
0001065837
srt:MinimumMember
us-gaap:BuildingImprovementsMember
2022-01-01
2022-12-31
0001065837
us-gaap:BuildingImprovementsMember
srt:MaximumMember
2022-01-01
2022-12-31
0001065837
srt:MinimumMember
us-gaap:FurnitureAndFixturesMember
2022-01-01
2022-12-31
0001065837
us-gaap:FurnitureAndFixturesMember
srt:MaximumMember
2022-01-01
2022-12-31
0001065837
us-gaap:LeaseholdImprovementsMember
2022-01-01
2022-12-31
0001065837
skx:ReacquiredRightsMember
2022-12-31
0001065837
skx:ReacquiredRightsMember
2021-12-31
0001065837
skx:ReacquiredRightsMember
2022-01-01
2022-12-31
0001065837
skx:ReacquiredRightsMember
2021-01-01
2021-12-31
0001065837
skx:HongKongJointVentureMember
2021-03-01
2021-03-31
skx:Derivative
0001065837
us-gaap:InterestRateSwapMember
us-gaap:FairValueInputsLevel2Member
2022-12-31
0001065837
us-gaap:CashMember
2022-12-31
0001065837
us-gaap:MoneyMarketFundsMember
us-gaap:FairValueInputsLevel1Member
2022-12-31
0001065837
us-gaap:USTreasurySecuritiesMember
us-gaap:FairValueInputsLevel1Member
2022-12-31
0001065837
us-gaap:FairValueInputsLevel1Member
2022-12-31
0001065837
skx:CorporateNotesAndBondsMember
us-gaap:FairValueInputsLevel2Member
2022-12-31
0001065837
us-gaap:FairValueInputsLevel2Member
2022-12-31
0001065837
us-gaap:AssetBackedSecuritiesMember
us-gaap:FairValueInputsLevel2Member
2022-12-31
0001065837
us-gaap:MutualFundMember
us-gaap:FairValueInputsLevel2Member
2022-12-31
0001065837
us-gaap:CashMember
2021-12-31
0001065837
us-gaap:MoneyMarketFundsMember
us-gaap:FairValueInputsLevel1Member
2021-12-31
0001065837
us-gaap:FairValueInputsLevel1Member
2021-12-31
0001065837
us-gaap:USTreasurySecuritiesMember
us-gaap:FairValueInputsLevel1Member
2021-12-31
0001065837
skx:CorporateNotesAndBondsMember
us-gaap:FairValueInputsLevel2Member
2021-12-31
0001065837
us-gaap:AssetBackedSecuritiesMember
us-gaap:FairValueInputsLevel2Member
2021-12-31
0001065837
us-gaap:MutualFundMember
us-gaap:FairValueInputsLevel2Member
2021-12-31
0001065837
us-gaap:FairValueInputsLevel2Member
2021-12-31
0001065837
srt:MaximumMember
2021-01-01
2021-12-31
0001065837
us-gaap:TermLifeInsuranceMember
2022-12-31
0001065837
us-gaap:TermLifeInsuranceMember
2021-12-31
0001065837
skx:RetailStoresLeasesMember
srt:MinimumMember
2022-12-31
0001065837
skx:RetailStoresLeasesMember
srt:MaximumMember
2022-12-31
0001065837
skx:OtherRealEstateOrFacilityLeasesMember
srt:MaximumMember
2022-12-31
xbrli:pure
0001065837
skx:NewRetailStoreLeasesMember
2022-12-31
0001065837
skx:HFLogisticsOneDistributionCenterLoanMember
2022-12-31
0001065837
skx:HFLogisticsOneDistributionCenterLoanMember
2021-12-31
0001065837
skx:HFLogisticsTwoDistributionCenterConstructionLoanMember
2022-12-31
0001065837
skx:HFLogisticsTwoDistributionCenterConstructionLoanMember
2021-12-31
0001065837
skx:ChinaDistributionCenterConstructionLoanAgreementMember
2022-12-31
0001065837
skx:ChinaDistributionCenterConstructionLoanAgreementMember
2021-12-31
0001065837
skx:ChinaDistributionCenterExpansionConstructionLoanMember
2022-12-31
0001065837
country:CN
2022-12-31
0001065837
country:CN
2021-12-31
0001065837
skx:OtherChinaOperationalLoansMember
2022-12-31
0001065837
skx:OtherChinaOperationalLoansMember
2021-12-31
0001065837
skx:UnsecuredRevolvingCreditFacilityMember
skx:TwoThousandNineteenCreditAgreementMember
2021-12-15
0001065837
skx:UnsecuredRevolvingCreditFacilityMember
skx:TwoThousandNineteenCreditAgreementMember
2019-11-21
0001065837
skx:UnsecuredRevolvingCreditFacilityMember
skx:TwoThousandNineteenCreditAgreementMember
2021-12-15
2021-12-15
0001065837
skx:UnsecuredRevolvingCreditFacilityMember
skx:TwoThousandNineteenCreditAgreementMember
2019-11-21
2019-11-21
0001065837
us-gaap:LineOfCreditMember
srt:MaximumMember
skx:TwoThousandNineteenCreditAgreementMember
2021-12-15
0001065837
us-gaap:LetterOfCreditMember
skx:TwoThousandNineteenCreditAgreementMember
2021-12-15
0001065837
skx:SwinglineLoansMember
skx:TwoThousandNineteenCreditAgreementMember
2021-12-15
0001065837
us-gaap:LineOfCreditMember
skx:TwoThousandNineteenCreditAgreementMember
2022-01-01
2022-12-31
0001065837
skx:RevolvingCreditFacilityAndLetterOfCreditMember
srt:MinimumMember
skx:TwoThousandNineteenCreditAgreementMember
us-gaap:SecuredOvernightFinancingRateSofrOvernightIndexSwapRateMember
2021-12-15
2021-12-15
0001065837
skx:RevolvingCreditFacilityAndLetterOfCreditMember
srt:MaximumMember
skx:TwoThousandNineteenCreditAgreementMember
us-gaap:SecuredOvernightFinancingRateSofrOvernightIndexSwapRateMember
2021-12-15
2021-12-15
0001065837
skx:RevolvingCreditFacilityAndLetterOfCreditMember
skx:TwoThousandNineteenCreditAgreementMember
us-gaap:FederalFundsEffectiveSwapRateMember
2021-12-15
2021-12-15
0001065837
skx:RevolvingCreditFacilityAndLetterOfCreditMember
skx:TwoThousandNineteenCreditAgreementMember
us-gaap:SecuredOvernightFinancingRateSofrOvernightIndexSwapRateMember
2021-12-15
2021-12-15
0001065837
skx:RevolvingCreditFacilityAndLetterOfCreditMember
skx:TwoThousandNineteenCreditAgreementMember
skx:TermSOFRPlusOnePointZeroZeroPercentageMember
2021-12-15
2021-12-15
0001065837
skx:RevolvingCreditFacilityAndLetterOfCreditMember
srt:MinimumMember
skx:TwoThousandNineteenCreditAgreementMember
skx:TermSOFRPlusOnePointZeroZeroPercentageMember
2021-12-15
2021-12-15
0001065837
skx:RevolvingCreditFacilityAndLetterOfCreditMember
srt:MaximumMember
skx:TwoThousandNineteenCreditAgreementMember
skx:TermSOFRPlusOnePointZeroZeroPercentageMember
2021-12-15
2021-12-15
0001065837
skx:RevolvingCreditFacilityAndLetterOfCreditMember
skx:TwoThousandNineteenCreditAgreementMember
2022-12-31
0001065837
skx:TwoThousandNineteenCreditAgreementMember
us-gaap:LineOfCreditMember
2021-12-15
2021-12-15
0001065837
skx:TwoThousandNineteenCreditAgreementMember
2022-12-31
0001065837
skx:TwoThousandNineteenCreditAgreementMember
2021-12-31
0001065837
skx:TwentyFifteenLoanMember
skx:JointVentureWithHFLogisticsMember
skx:AmendedConstructionLoanAgreementMember
2022-12-31
0001065837
skx:TwentyFifteenLoanMember
skx:JointVentureWithHFLogisticsMember
skx:AmendedConstructionLoanAgreementMember
us-gaap:LondonInterbankOfferedRateLIBORMember
2022-01-01
2022-12-31
0001065837
skx:HFLogisticsOneDistributionCenterLoanMember
skx:AmendmentToAmendedLoanAgreementMember
srt:MinimumMember
2020-03-18
0001065837
skx:HFLogisticsOneDistributionCenterLoanMember
skx:JointVentureWithHFLogisticsMember
skx:AmendmentToAmendedLoanAgreementMember
2020-03-17
2020-03-18
0001065837
skx:HFLogisticsOneDistributionCenterLoanMember
skx:JointVentureWithHFLogisticsMember
skx:AmendmentToAmendedLoanAgreementMember
us-gaap:LondonInterbankOfferedRateLIBORMember
us-gaap:InterestRateSwapMember
2020-03-17
2020-03-18
0001065837
skx:HFLogisticsOneDistributionCenterLoanMember
skx:JointVentureWithHFLogisticsMember
skx:AmendmentToAmendedLoanAgreementMember
us-gaap:LondonInterbankOfferedRateLIBORMember
us-gaap:InterestRateSwapMember
2022-01-01
2022-12-31
0001065837
skx:JointVentureWithHFLogisticsMember
skx:ConstructionLoanAgreementMember
us-gaap:InterestRateSwapMember
skx:HFLogisticsOneDistributionCenterLoanMember
2020-03-17
2020-03-18
0001065837
skx:JointVentureWithHFLogisticsMember
skx:ConstructionLoanAgreementMember
us-gaap:InterestRateSwapMember
skx:HFLogisticsOneDistributionCenterLoanMember
2020-03-18
0001065837
skx:JointVentureWithHFLogisticsMember
skx:ConstructionLoanAgreementMember
us-gaap:InterestRateSwapMember
2020-03-17
2020-03-18
0001065837
us-gaap:InterestRateSwapMember
2022-12-31
0001065837
srt:MaximumMember
skx:HFLogisticsTwoDistributionCenterConstructionLoanMember
skx:JointVentureWithHFLogisticsMember
skx:TwentyTwentyConstructionLoanAgreementMember
2020-04-03
0001065837
skx:HFLogisticsTwoDistributionCenterConstructionLoanMember
skx:JointVentureWithHFLogisticsMember
skx:TwentyTwentyConstructionLoanAgreementMember
2022-01-01
2022-12-31
0001065837
skx:HFLogisticsTwoDistributionCenterConstructionLoanMember
skx:JointVentureWithHFLogisticsMember
skx:TwentyTwentyConstructionLoanAgreementMember
2020-04-02
2020-04-03
0001065837
skx:HFLogisticsTwoDistributionCenterConstructionLoanMember
skx:JointVentureWithHFLogisticsMember
skx:TwentyTwentyConstructionLoanAgreementMember
2022-12-31
iso4217:CNY
0001065837
skx:ChinaDistributionCenterConstructionLoanAgreementMember
2018-09-29
0001065837
skx:ChinaDistributionCenterConstructionLoanAgreementMember
2018-09-28
2018-09-29
0001065837
skx:ChinaDistributionCenterConstructionLoanAgreementMember
2022-01-01
2022-12-31
0001065837
skx:ChinaDistributionCenterExpansionConstructionLoanMember
2022-10-18
0001065837
skx:ChinaDistributionCenterExpansionConstructionLoanMember
2022-10-18
2022-10-18
0001065837
srt:MinimumMember
skx:OtherChinaOperationalLoansMember
skx:OnePointZeroZeroToThreePointSevenZeroPercentageLoansPayableMember
2021-12-31
0001065837
srt:MaximumMember
skx:OtherChinaOperationalLoansMember
skx:OnePointZeroZeroToThreePointSevenZeroPercentageLoansPayableMember
2021-12-31
0001065837
srt:MinimumMember
skx:OtherChinaOperationalLoansMember
skx:TwoPointNineZeroToThreePointFourOnePercentageLoansPayableMember
2022-12-31
0001065837
srt:MaximumMember
skx:OtherChinaOperationalLoansMember
skx:TwoPointNineZeroToThreePointFourOnePercentageLoansPayableMember
2022-12-31
0001065837
skx:OtherChinaOperationalLoansMember
skx:ShanghaiMember
2022-12-31
0001065837
skx:OtherChinaOperationalLoansMember
skx:ShanghaiMember
2021-12-31
0001065837
skx:OtherChinaOperationalLoansMember
skx:FourPointTwoEightPercentageLoansPayableMember
skx:ShanghaiMember
2022-12-31
0001065837
skx:OtherChinaOperationalLoansMember
skx:FourPointTwoEightPercentageLoansPayableMember
skx:ShanghaiMember
2021-12-31
0001065837
skx:OtherChinaOperationalLoansMember
skx:WorkingCapitalLoansMember
2022-12-31
0001065837
skx:WarehouseAndEquipmentAndCorporateConstructionContractsExpansionMember
2022-01-01
2022-12-31
0001065837
us-gaap:CommonClassAMember
2022-01-01
2022-12-31
0001065837
us-gaap:CommonClassBMember
2022-01-01
2022-12-31
0001065837
us-gaap:CommonClassBMember
2021-01-01
2021-12-31
0001065837
us-gaap:CommonClassBMember
2020-01-01
2020-12-31
0001065837
us-gaap:CommonClassAMember
2022-01-31
0001065837
skx:TwoThousandSeventeenPlanMember
us-gaap:CommonClassAMember
2022-12-31
0001065837
us-gaap:PerformanceSharesMember
skx:TwoThousandSeventeenPlanMember
2022-12-31
0001065837
us-gaap:PerformanceSharesMember
srt:MaximumMember
skx:TwoThousandSeventeenPlanMember
2022-12-31
0001065837
us-gaap:PerformanceSharesMember
2022-01-01
2022-12-31
0001065837
us-gaap:PerformanceSharesMember
srt:MinimumMember
2022-01-01
2022-12-31
0001065837
us-gaap:PerformanceSharesMember
srt:MaximumMember
2022-01-01
2022-12-31
0001065837
us-gaap:RestrictedStockMember
2022-01-01
2022-12-31
0001065837
skx:MarketBasedRestrictedStockMember
2022-01-01
2022-12-31
0001065837
us-gaap:RestrictedStockMember
2021-01-01
2021-12-31
0001065837
us-gaap:PerformanceSharesMember
2021-01-01
2021-12-31
0001065837
skx:MarketBasedRestrictedStockMember
2021-01-01
2021-12-31
0001065837
us-gaap:RestrictedStockMember
2020-01-01
2020-12-31
0001065837
us-gaap:PerformanceSharesMember
2020-01-01
2020-12-31
0001065837
skx:MarketBasedRestrictedStockMember
2020-01-01
2020-12-31
0001065837
srt:MinimumMember
2022-01-01
2022-12-31
0001065837
srt:MaximumMember
2022-01-01
2022-12-31
0001065837
skx:TwoThousandEighteenEmployeeStockPurchasePlanMember
us-gaap:CommonClassAMember
2017-05-23
0001065837
skx:TwoThousandEighteenEmployeeStockPurchasePlanMember
2022-01-01
2022-12-31
0001065837
skx:TwoThousandEighteenEmployeeStockPurchasePlanMember
2022-12-31
0001065837
us-gaap:EmployeeStockMember
2022-01-01
2022-12-31
0001065837
us-gaap:EmployeeStockMember
2021-01-01
2021-12-31
0001065837
us-gaap:EmployeeStockMember
2020-01-01
2020-12-31
0001065837
skx:TwoThousandEighteenEmployeeStockPurchasePlanMember
2021-01-01
2021-12-31
0001065837
skx:TwoThousandEighteenEmployeeStockPurchasePlanMember
2020-01-01
2020-12-31
0001065837
srt:MinimumMember
us-gaap:ForeignCountryMember
2022-01-01
2022-12-31
0001065837
srt:MaximumMember
us-gaap:ForeignCountryMember
2022-01-01
2022-12-31
0001065837
us-gaap:ForeignCountryMember
2022-12-31
0001065837
us-gaap:ForeignCountryMember
2022-01-01
2022-12-31
0001065837
country:CH
2021-01-01
2021-12-31
0001065837
country:CH
2022-01-01
2022-12-31
0001065837
skx:USFederalMember
2022-12-31
0001065837
skx:StateMember
2022-12-31
0001065837
skx:StateMember
2022-01-01
2022-12-31
0001065837
us-gaap:SettlementWithTaxingAuthorityMember
skx:DomesticAndForeignMember
2022-12-31
0001065837
skx:SettlementOfDomesticAndForeignAuditsMember
2022-12-31
0001065837
us-gaap:DeferredCompensationArrangementWithIndividualByTypeOfCompensationPensionAndOtherPostretirementBenefitsMember
2022-01-01
2022-12-31
0001065837
us-gaap:DeferredCompensationArrangementWithIndividualByTypeOfCompensationPensionAndOtherPostretirementBenefitsMember
2021-01-01
2021-12-31
0001065837
us-gaap:DeferredCompensationArrangementWithIndividualByTypeOfCompensationPensionAndOtherPostretirementBenefitsMember
2020-01-01
2020-12-31
skx:Property
0001065837
2021-03-31
0001065837
2021-03-01
2021-03-31
0001065837
skx:WholesaleMember
2022-01-01
2022-12-31
0001065837
skx:WholesaleMember
2021-01-01
2021-12-31
0001065837
skx:WholesaleMember
2020-01-01
2020-12-31
0001065837
skx:DirectToConsumerMember
2022-01-01
2022-12-31
0001065837
skx:DirectToConsumerMember
2021-01-01
2021-12-31
0001065837
skx:DirectToConsumerMember
2020-01-01
2020-12-31
0001065837
skx:WholesaleMember
2022-12-31
0001065837
skx:WholesaleMember
2021-12-31
0001065837
skx:DirectToConsumerMember
2022-12-31
0001065837
skx:DirectToConsumerMember
2021-12-31
0001065837
skx:WholesaleMember
country:US
2022-01-01
2022-12-31
0001065837
skx:WholesaleMember
country:US
2021-01-01
2021-12-31
0001065837
skx:WholesaleMember
country:US
2020-01-01
2020-12-31
0001065837
skx:DirectToConsumerMember
country:US
2022-01-01
2022-12-31
0001065837
skx:DirectToConsumerMember
country:US
2021-01-01
2021-12-31
0001065837
skx:DirectToConsumerMember
country:US
2020-01-01
2020-12-31
0001065837
country:US
2022-01-01
2022-12-31
0001065837
country:US
2021-01-01
2021-12-31
0001065837
country:US
2020-01-01
2020-12-31
0001065837
skx:WholesaleMember
us-gaap:NonUsMember
2022-01-01
2022-12-31
0001065837
skx:WholesaleMember
us-gaap:NonUsMember
2021-01-01
2021-12-31
0001065837
skx:WholesaleMember
us-gaap:NonUsMember
2020-01-01
2020-12-31
0001065837
skx:DirectToConsumerMember
us-gaap:NonUsMember
2022-01-01
2022-12-31
0001065837
skx:DirectToConsumerMember
us-gaap:NonUsMember
2021-01-01
2021-12-31
0001065837
skx:DirectToConsumerMember
us-gaap:NonUsMember
2020-01-01
2020-12-31
0001065837
us-gaap:NonUsMember
2022-01-01
2022-12-31
0001065837
us-gaap:NonUsMember
2021-01-01
2021-12-31
0001065837
us-gaap:NonUsMember
2020-01-01
2020-12-31
0001065837
srt:AmericasMember
2022-01-01
2022-12-31
0001065837
srt:AmericasMember
2021-01-01
2021-12-31
0001065837
srt:AmericasMember
2020-01-01
2020-12-31
0001065837
skx:EuropeMiddleEastAndAfricaMember
2022-01-01
2022-12-31
0001065837
skx:EuropeMiddleEastAndAfricaMember
2021-01-01
2021-12-31
0001065837
skx:EuropeMiddleEastAndAfricaMember
2020-01-01
2020-12-31
0001065837
srt:AsiaPacificMember
2022-01-01
2022-12-31
0001065837
srt:AsiaPacificMember
2021-01-01
2021-12-31
0001065837
srt:AsiaPacificMember
2020-01-01
2020-12-31
0001065837
country:CN
2022-01-01
2022-12-31
0001065837
country:CN
2021-01-01
2021-12-31
0001065837
country:CN
2020-01-01
2020-12-31
0001065837
country:US
2022-12-31
0001065837
country:US
2021-12-31
0001065837
us-gaap:NonUsMember
2022-12-31
0001065837
us-gaap:NonUsMember
2021-12-31
skx:Customer
0001065837
us-gaap:SalesRevenueNetMember
us-gaap:CustomerConcentrationRiskMember
2022-01-01
2022-12-31
0001065837
us-gaap:SalesRevenueNetMember
us-gaap:CustomerConcentrationRiskMember
2021-01-01
2021-12-31
0001065837
us-gaap:SalesRevenueNetMember
us-gaap:CustomerConcentrationRiskMember
2020-01-01
2020-12-31
0001065837
us-gaap:SalesRevenueNetMember
us-gaap:CustomerConcentrationRiskMember
skx:FiveLargestCustomersMember
2022-01-01
2022-12-31
0001065837
us-gaap:SalesRevenueNetMember
us-gaap:CustomerConcentrationRiskMember
skx:FiveLargestCustomersMember
2021-01-01
2021-12-31
0001065837
us-gaap:SalesRevenueNetMember
us-gaap:CustomerConcentrationRiskMember
skx:FiveLargestCustomersMember
2020-01-01
2020-12-31
0001065837
us-gaap:CostOfGoodsTotalMember
us-gaap:SupplierConcentrationRiskMember
skx:ManufacturerOneMember
2022-01-01
2022-12-31
0001065837
us-gaap:CostOfGoodsTotalMember
us-gaap:SupplierConcentrationRiskMember
skx:ManufacturerOneMember
2021-01-01
2021-12-31
0001065837
us-gaap:CostOfGoodsTotalMember
us-gaap:SupplierConcentrationRiskMember
skx:ManufacturerOneMember
2020-01-01
2020-12-31
0001065837
us-gaap:CostOfGoodsTotalMember
us-gaap:SupplierConcentrationRiskMember
skx:ManufacturerTwoMember
2022-01-01
2022-12-31
0001065837
us-gaap:CostOfGoodsTotalMember
us-gaap:SupplierConcentrationRiskMember
skx:ManufacturerTwoMember
2021-01-01
2021-12-31
0001065837
us-gaap:CostOfGoodsTotalMember
us-gaap:SupplierConcentrationRiskMember
skx:ManufacturerTwoMember
2020-01-01
2020-12-31
0001065837
us-gaap:CostOfGoodsTotalMember
us-gaap:SupplierConcentrationRiskMember
skx:ManufacturerThreeMember
2022-01-01
2022-12-31
0001065837
us-gaap:CostOfGoodsTotalMember
us-gaap:SupplierConcentrationRiskMember
skx:ManufacturerThreeMember
2021-01-01
2021-12-31
0001065837
us-gaap:CostOfGoodsTotalMember
us-gaap:SupplierConcentrationRiskMember
skx:ManufacturerThreeMember
2020-01-01
2020-12-31
0001065837
us-gaap:CostOfGoodsTotalMember
us-gaap:SupplierConcentrationRiskMember
skx:ManufacturerFourMember
2022-01-01
2022-12-31
0001065837
us-gaap:CostOfGoodsTotalMember
us-gaap:SupplierConcentrationRiskMember
skx:ManufacturerFourMember
2021-01-01
2021-12-31
0001065837
us-gaap:CostOfGoodsTotalMember
us-gaap:SupplierConcentrationRiskMember
skx:ManufacturerFourMember
2020-01-01
2020-12-31
0001065837
us-gaap:CostOfGoodsTotalMember
us-gaap:SupplierConcentrationRiskMember
skx:ManufacturerFiveMember
2022-01-01
2022-12-31
0001065837
us-gaap:CostOfGoodsTotalMember
us-gaap:SupplierConcentrationRiskMember
skx:ManufacturerFiveMember
2021-01-01
2021-12-31
0001065837
us-gaap:CostOfGoodsTotalMember
us-gaap:SupplierConcentrationRiskMember
skx:ManufacturerFiveMember
2020-01-01
2020-12-31
0001065837
us-gaap:CostOfGoodsTotalMember
us-gaap:SupplierConcentrationRiskMember
skx:TopFiveManufacturersMember
2022-01-01
2022-12-31
0001065837
us-gaap:CostOfGoodsTotalMember
us-gaap:SupplierConcentrationRiskMember
skx:TopFiveManufacturersMember
2021-01-01
2021-12-31
0001065837
us-gaap:CostOfGoodsTotalMember
us-gaap:SupplierConcentrationRiskMember
skx:TopFiveManufacturersMember
2020-01-01
2020-12-31
0001065837
us-gaap:AllowanceForCreditLossMember
2019-12-31
0001065837
us-gaap:AllowanceForNotesReceivableMember
2019-12-31
0001065837
skx:LiabilityForSalesReturnsAndAllowancesMember
2019-12-31
0001065837
us-gaap:InventoryValuationReserveMember
2019-12-31
0001065837
us-gaap:AllowanceForCreditLossMember
2020-12-31
0001065837
us-gaap:AllowanceForNotesReceivableMember
2020-12-31
0001065837
skx:LiabilityForSalesReturnsAndAllowancesMember
2020-12-31
0001065837
us-gaap:InventoryValuationReserveMember
2020-12-31
0001065837
us-gaap:AllowanceForCreditLossMember
2021-12-31
0001065837
us-gaap:AllowanceForNotesReceivableMember
2021-12-31
0001065837
skx:LiabilityForSalesReturnsAndAllowancesMember
2021-12-31
0001065837
us-gaap:InventoryValuationReserveMember
2021-12-31
0001065837
us-gaap:AllowanceForCreditLossMember
2020-01-01
2020-12-31
0001065837
us-gaap:AllowanceForNotesReceivableMember
2020-01-01
2020-12-31
0001065837
skx:LiabilityForSalesReturnsAndAllowancesMember
2020-01-01
2020-12-31
0001065837
us-gaap:InventoryValuationReserveMember
2020-01-01
2020-12-31
0001065837
us-gaap:AllowanceForCreditLossMember
2021-01-01
2021-12-31
0001065837
us-gaap:AllowanceForNotesReceivableMember
2021-01-01
2021-12-31
0001065837
skx:LiabilityForSalesReturnsAndAllowancesMember
2021-01-01
2021-12-31
0001065837
us-gaap:InventoryValuationReserveMember
2021-01-01
2021-12-31
0001065837
us-gaap:AllowanceForCreditLossMember
2022-01-01
2022-12-31
0001065837
us-gaap:AllowanceForNotesReceivableMember
2022-01-01
2022-12-31
0001065837
skx:LiabilityForSalesReturnsAndAllowancesMember
2022-01-01
2022-12-31
0001065837
us-gaap:InventoryValuationReserveMember
2022-01-01
2022-12-31
0001065837
us-gaap:AllowanceForCreditLossMember
2022-12-31
0001065837
us-gaap:AllowanceForNotesReceivableMember
2022-12-31
0001065837
skx:LiabilityForSalesReturnsAndAllowancesMember
2022-12-31
0001065837
us-gaap:InventoryValuationReserveMember
2022-12-31
UNITED STATES
SECURITIES AND EXCHANGE COMMISSION
Washington, D.C. 20549
FORM 10-K
|
☒ |
ANNUAL REPORT PURSUANT TO SECTION 13 OR 15(d) OF THE SECURITIES EXCHANGE ACT OF 1934 |
For the fiscal year ended December 31, 2022
or
|
☐ |
TRANSITION REPORT PURSUANT TO SECTION 13 OR 15(d) OF THE SECURITIES AND EXCHANGE ACT OF 1934 |
For the transition period from to
Commission File Number 001-14429
SKECHERS U.S.A., INC.
(Exact name of registrant as specified in its charter)
|
Delaware |
|
|
|
95-4376145 |
|
(State or other jurisdiction of incorporation or organization) |
|
|
|
(I.R.S. Employer Identification No.) |
228 Manhattan Beach Blvd.,
Manhattan Beach, California 90266
(310) 318-3100
(Address, including zip code, and telephone number, including area code)
Securities registered pursuant to Section 12(b) of the Act:
Class A Common Stock, par value $0.001 per share |
|
SKX |
|
New York Stock Exchange |
|
(Title of each class) |
|
(Trading symbol) |
|
(Name of each exchange on which registered) |
Securities registered pursuant to Section 12(g) of the Act: None
Indicate by check mark if the registrant is a well-known seasoned issuer, as defined in Rule 405 of the Securities Act. Yes ☒ No ☐
Indicate by check mark if the registrant is not required to file reports pursuant to Section 13 or Section 15(d) of the Act. Yes ☐ No ☒
Indicate by check mark whether the registrant: (1) has filed all reports required to be filed by Section 13 or 15(d) of the Securities Exchange Act of 1934 during the preceding 12 months (or for such shorter period that the registrant was required to file such reports), and (2) has been subject to such filing requirements for the past 90 days. Yes ☒ No ☐
Indicate by check mark whether the registrant has submitted electronically every Interactive Data File required to be submitted pursuant to Rule 405 of Regulation S-T(§ 232.405 of this chapter) during the preceding 12 months (or for such shorter period that the registrant was required to submit such files). Yes ☒ No ☐
Indicate by check mark whether the registrant is a large accelerated filer, an accelerated filer, a non-accelerated filer, smaller reporting company, or an emerging growth company. See definitions of “large accelerated filer,” “accelerated filer,” “smaller reporting company,” and “emerging growth company” in Rule 12b-2 of the Exchange Act.
|
Large accelerated filer |
|
☒ |
|
Accelerated filer |
|
☐ |
|
Non-accelerated filer |
|
☐ |
|
Smaller reporting company |
|
☐ |
|
|
|
|
|
Emerging growth company |
|
☐ |
If an emerging growth company, indicate by check mark if the registrant has elected not to use the extended transition period for complying with any new or revised financial accounting standards provided pursuant to Section 13(a) of the Exchange Act. ☐
Indicate by check mark whether the registrant has filed a report on and attestation to its management’s assessment of the effectiveness of its internal control over financial reporting under Section 404(b) of the Sarbanes-Oxley Act (15 U.S.C. 7262(b)) by the registered public accounting firm that prepared or issued its audit report. ☒
If securities are registered pursuant to Section 12(b) of the Act, indicate by check mark whether the financial statements of the registrant included in the filing reflect the correction of an error to previously issued financial statements. ☐
Indicate by check mark whether any of those error corrections are restatements that required a recovery analysis of incentive-based compensation received by any of the registrant’s executive officers during the relevant recovery period pursuant to §240.10D-1(b). ☐
Indicate by check mark whether the registrant is a shell company (as defined in Rule 12b-2 of the Exchange Act). Yes ☐ No ☒
As of June 30, 2022, the aggregate market value of the voting and non-voting Class A and Class B Common Stock held by non-affiliates of the registrant was approximately $4.9 billion based upon the closing price of $35.58 of the Class A Common Stock on the New York Stock Exchange on such date.
The number of shares of Class A Common Stock outstanding as of February 15, 2023: 134,473,612.
The number of shares of Class B Common Stock outstanding as of February 15, 2023: 20,810,041.
DOCUMENTS INCORPORATED BY REFERENCE
Portions of the registrant’s Definitive Proxy Statement issued in connection with the 2023 Annual Meeting of the Stockholders of the registrant are incorporated by reference into Part III.
Skechers U.S.A., INC. and subsidiaries
Form 10-K
Table of Contents
i
Special Note on Forward-Looking Statements
This annual report on Form 10-K contains forward-looking statements that are made pursuant to the safe harbor provisions of the Private Securities Litigation Reform Act of 1995, including statements with regards to future revenue, projected operating results, earnings, spending, margins, cash flow, orders, expected timing of shipment of products, inventory levels, future growth or success in specific countries, categories or market sectors, continued or expected distribution to specific retailers, liquidity, capital resources and market risk, strategies and objectives. Forward-looking statements include, without limitation, any statement that may predict, forecast, indicate or simply state future results, performance or achievements, and can be identified by the use of forward-looking language such as “believe,” “anticipate,” “expect,” “estimate,” “intend,” “plan,” “project,” “will,” “could,” “may,” “might,” or any variations of such words with similar meanings. These forward-looking statements involve risks and uncertainties that could cause actual results to differ materially from those projected in forward-looking statements, and reported results shall not be considered an indication of our future performance. Factors that might cause or contribute to such differences include:
|
|
• |
the COVID-19 pandemic and its adverse impact on our operations and our business, sales and results of operations around the world; |
|
|
• |
our ability to manage the impact from delays and disruptions in our supply chain; |
|
|
• |
our ability to sustain, manage and forecast our costs and proper inventory levels; |
|
|
• |
our ability to continue to manufacture and ship our products that are sourced in China and Vietnam, which could be adversely affected by various economic, political, health or trade conditions, or a natural disaster in China or Vietnam; |
|
|
• |
our ability to maintain our brand image and to anticipate, forecast, identify, and respond to changes in fashion trends, consumer demand for the products and other market factors; |
|
|
• |
the loss of any significant customers, decreased demand by industry retailers and the cancellation of order commitments; |
|
|
• |
our ability to remain competitive among sellers of footwear for consumers, including in the highly competitive performance footwear market; and |
|
|
• |
global economic, political and market conditions including the effects of inflation and foreign currency exchange rate fluctuations around the world, the challenging consumer retail market in the United States (“U.S.”) and the impact of Russia’s war with Ukraine. |
The risks included here are not exhaustive. Other sections of this report may include additional factors that could adversely impact our business, financial condition and results of operations. Moreover, we operate in a very competitive and rapidly changing environment, and new risk factors emerge from time to time. We cannot predict all such risk factors, nor can we assess the impact of all such risk factors on our business or the extent to which any factor or combination of factors may cause actual results to differ materially from those contained in any forward-looking statements. Given these inherent and changing risks and uncertainties, investors should not place undue reliance on forward-looking statements, which reflect our opinions only as of the date of this annual report, as a prediction of actual results. We undertake no obligation to publicly release any revisions to the forward-looking statements after the date of this document, except as otherwise required by reporting requirements of applicable federal and state securities laws.
1
PART I
Skechers U.S.A., Inc., The Comfort Technology CompanyTM, was incorporated in California in 1992 and reincorporated in Delaware in 1999. Skechers U.S.A., Inc., its consolidated subsidiaries and certain variable interest entities (“VIEs”) of which it is the primary beneficiary, is referred to throughout this annual report as “we,” “us,” “our,” “the Company” and “Skechers” unless otherwise indicated. Reference in this annual report to “sales” refers to Skechers’ net sales reported under U.S. generally accepted accounting principles. Our internet address is www.skechers.com. Our annual report on Form 10-K, quarterly reports on Form 10-Q, current reports on Form 8-K, Form 3’s, 4’s and 5’s filed on behalf of directors, officers and 10% stockholders, and any amendments to those reports filed or furnished pursuant to Section 13(a) or 15(d) of the Exchange Act are available free of charge on our corporate website, www.investors.skechers.com, as soon as reasonably practicable after we electronically file such material with, or furnish it to, the U.S. Securities and Exchange Commission (“SEC”). You can learn more about us by reviewing such filings at www.investors.skechers.com or at the SEC’s website, www.sec.gov.
GENERAL
We design and market Skechers-branded lifestyle footwear for men, women and children, performance footwear for men and women under the Skechers Performance brand name, and work footwear for men and women under Skechers Work brand name. We design and market Skechers branded lifestyle apparel and license the Skechers brand to others for accessories, pet accessories, leather goods, eyewear and medical scrubs, among other categories. Skechers footwear reflects a combination of style, quality, comfort, innovation and value that appeals to a broad range of consumers. Our product offering is sold through wholesale distribution to department and specialty stores, athletic and independent retailers, and e-commerce retailers, and directly to consumers through Skechers brick and mortar and digital stores. Our objective is to profitably grow our operations worldwide while leveraging our recognizable Skechers brand through our diversified product lines, innovative advertising and various distribution channels.
We believe that brand recognition is an important element for success in the footwear business. We aggressively market our brands through comprehensive marketing campaigns for men, women and children. The Skechers brand is supported by print, television, digital, radio, outdoor and press campaigns as well as donation events for BOBS from Skechers. To further drive recognition, we enlist numerous celebrities, former and current athletes, and influencers to appear in our campaigns. In 2022, our brand ambassadors included television personalities and entertainers Martha Stewart, Amanda Kloots, Brooke Burke, Willie Nelson and Chesca, athlete Clayton Kershaw, and former athletes Sugar Ray Leonard, Tony Romo, Howie Long, Cris Carter, Meb Keflezighi, and Rusty Wallace. More recently, culture and entertainment icon Snoop Dogg joined our stable of brand ambassadors. Additionally, athletes supporting our performance footwear included runner Edward Cheserek, elite golfers Matt Fitzpatrick, Brooke Henderson and Colin Montgomerie, and pro pickleball players Tyson McGuffin and Catherine Parenteau.
Since 1992, when we introduced our first line, Skechers USA Sport Utility Footwear, we have expanded our product offering and grown our sales while substantially increasing the breadth and penetration of our account and customer base. Our men’s, women’s and children’s product lines benefit from the Skechers reputation for style, quality, comfort, and innovation all at a reasonable price. Our Performance lines benefit from our marketing, product development, technology, wins on the course or track, and feedback from athletes and wear testers.
SKECHERS LINES
We offer a wide array of Skechers-branded footwear lines, many of which have collections that have developed into well-known names. Most of these collections are marketed and packaged with unique shoe boxes, hangtags and in-store support.
From fashion styles to lifestyle product and performance shoes for sport enthusiasts, our offering is enhanced with the Company’s signature comfort innovations—including its Skechers Arch Fit® Technology, Skechers Max Cushioning® Technology, Skechers Air‑Cooled Memory Foam®, Skechers Relaxed Fit® Technology, Skechers Stretch Fit® Technology, Skechers Hands Free Slip-ins® Technology, Skechers Hyper Burst® Technology, and Massage Fit® Technology.
Lifestyle Brands. Our lifestyle offering includes categories such as Skechers USA, Skechers Sport, Skechers Active, Modern Comfort, Skechers Street, Foamies, Mark Nason, the charity-minded BOBS from Skechers collection, and the recycled materials line Our Planet Matters, among others. Types of footwear sold under this division include casual, casual athletic, sport athletic, trail, sandals, boots, and fashion, and also include the well-known Skechers Uno, Skechers Arch Fit®, and new in 2022, Skechers Hands Free Slip-ins™. Innovation is also important within our lifestyle offering and select styles include patented designs including podiatrist-certified arch support and outsoles for enhanced traction, stability and durability.
Within our lifestyle collections are collaborations with known brands and properties—including street artists like James Goldcrown and well-known animated characters like tokidoki.
2
Performance Brands. Skechers Performance encompasses several technical footwear lines, each designed for specific activities to maximize performance and promote comfort. The Skechers Performance division designs footwear to utilize the latest advancements in materials and innovative design, including lightweight Ultra GO and Hyper Burst midsole compounds for comfort and responsive feedback. Skechers Performance includes the lines Skechers GOrun, Skechers GOwalk, Skechers GOtrain, Skechers GOtrail, and Skechers GO Golf as well as Skechers Viper Court for pickleball.
Skechers Kids. Skechers Kids is comprised of a wide range of sneakers, casuals, boots, and sandals for boys and girls of all ages – pairing the latest trends with innovative comfort technology. The Skechers Kids offering includes its namesake collection, S-Lights, Skech-Air, Foamies, Twinkle Toes, Skechers Stretch Fit, and Skechers Street.
Skechers Work. Skechers Work offers a complete line of men’s and women’s slip-resistant and safety-toe casuals, boots, hikers and athletic shoes for professionals who use protective footwear in their work environments. Skechers Work styles include Skechers comfort technologies along with safety and durability features such as steel, composite and lightweight safety toes; high-abrasion soles; puncture resistance; waterproofing and electrostatic-dissipative technology.
Skechers Apparel. Skechers designs and markets a collection of lifestyle apparel for men, women and kids. The collection features Skechers characteristics that consumers around the world have come to expect from the brand. The activewear garments are designed to directly coordinate with the brand’s footwear products. The Skechers apparel collection is sold at Skechers retail stores, on our websites and through wholesale customers.
PRODUCT DESIGN AND DEVELOPMENT
Our principal goal in product design is to develop innovative, comfortable, stylish, quality footwear at a reasonable price for the entire family. Our performance products are for professional and recreational athletes who want a technical shoe that performs under the demands of competition. Our occupational footwear is designed to meet the specifications and demands of the service, medical and construction industries while also meeting testing specifications in the markets where the product is sold.
We believe that our products’ success is related to our ability to recognize trends in the footwear markets and to design products that anticipate and accommodate consumers’ ever-evolving preferences. Lifestyle trend information is compiled and analyzed by our designers in various ways, including reviewing and analyzing pop culture, clothing, and trend-setting media; consulting with our customers for information on current retail selling trends; participating in major footwear trade shows to stay abreast of popular brands, fashions and styles; and subscribing to various fashion and color information services. In addition, a key component of our design philosophy is to continually reinterpret and improve our most successful styles.
SOURCING
Factories. Our products are produced by independent contract manufacturers located primarily in Asia. We do not own or operate any manufacturing facilities. We believe that the use of independent manufacturers substantially increases our production flexibility and capacity, while reducing capital expenditures and avoiding the costs of managing a large production work force.
When possible, we seek to use manufacturers that have previously produced our footwear, which we believe enhances continuity and quality while controlling production costs. To help avoid disruption of our product supply due to political instability, civil unrest, economic instability, changes in government policies or regulations, natural and manmade disasters, and other risks, we source product from multiple facilities across multiple countries. We believe that the existing production capacity at our third-party manufacturers’ facilities is sufficient to handle expected volume in the foreseeable future.
Production Oversight. To safeguard product quality and consistency, we oversee the key aspects of production from initial prototype manufacture, through initial production runs, to final manufacture. Monitoring of all production is performed in the U.S. by our in-house production department and in Asia by staff working from our offices in China and Vietnam. We believe that our Asia presence allows us to negotiate supplier and manufacturer arrangements more effectively, decrease product turnaround time, and ensure timely delivery of finished footwear. In addition, we require our manufacturers to operate in a manner consistent with the Skechers Supplier Code of Conduct posted on our corporate website. We partner with factories that ensure humane conditions for their employees and we engage in routine auditing and monitoring procedures to ensure that those who contribute to our product are treated with civility and respect.
Quality Control. We believe quality control is an important and effective means of maintaining the quality and reputation of our products and brand. Our quality control program is designed to ensure finished goods meet our established design specifications and all goods bearing our trademarks meet our standards for quality. Our quality control personnel located in China and Vietnam perform an array of inspection procedures at various stages of the production process, including examination and testing of prototypes of key raw materials prior to manufacture, samples and materials at various stages of production and final products prior to shipment. Our employees are on-site at each of our major manufacturers to oversee production. For some of our lower volume manufacturers, our staff is on-site during significant production runs, or we perform unannounced visits to their manufacturing sites to further monitor compliance with our manufacturing specifications.
3
Sustainability. We believe sustainability is an important responsibility in managing our business. In 2021, we introduced Our Planet Matters, a collection for men, women and kids that utilizes recycled materials. We partnered with a global conservation organization to help fund its organization’s global efforts which align with our interests and commitment to reduce tree harvesting and emissions through packaging.
We worked to make our packaging more sustainable for the more-than-225 million units of Skechers that consumers purchased in 2022. Since 2016, we have reduced our products’ packaging plastics by 99% down to less than 1%; all of which is recyclable. Many facilities can now recycle 93% of Skechers-branded shoeboxes, and all of our foot forms and tissue paper packaging are recyclable and printed with soy-or water-based ink. Further, 99% of our shoeboxes meet the FSC® standard for responsible resources, and we continually look for new ways to improve with green materials, regular assessments, and assurance that our items are FSC-certified, recycled or ethically harvested. Our shipping methods reflect our green-minded approach to sustainability: master cartons are printed with soy-or-water-based ink and are 100% recyclable, and at the distribution centers managing more than 90% of our business, our outbound shipping cartons are composed of 96%-100% recycled materials and are 100% recyclable.
Many of our facilities are designed and operated with sustainability in mind, including one of America’s largest LEED Gold certified facilities at our North America distribution center in Southern California. Our expanding corporate offices in Los Angeles, California are being designed and developed to qualify for LEED Gold certification. Our European Distribution Center in Liege, Belgium, has both a BREEAM Very Good rating and a Lean and Green certification.
ADVERTISING AND MARKETING
With a marketing philosophy of “Unseen, Untold, Unsold,” we take a targeted and 360-degree approach to marketing to drive traffic, build brand recognition and properly position our diverse lines within the marketplace. Senior management is directly involved in shaping our image and the conception, development and implementation of our advertising and marketing activities. Our marketing strategy has an omni-channel approach, and we utilize print, outdoor, television, radio, and digital, along with public relations, influencers and social media, promotions, and in-store events. In addition, we utilize celebrity and athlete endorsers in some of our advertisements.
PRODUCT DISTRIBUTION
We have two reportable segments: Wholesale and Direct-to-Consumer. The Company’s collections are available in approximately 180 countries and territories through department and specialty stores, and direct to consumers through digital stores and approximately 4,540 Company- and third-party-owned physical retail stores. The Company manages its international business through a network of wholly-owned subsidiaries, joint venture partners, and distributors.
Our subsidiaries and joint ventures merchandise, market and distribute Skechers product to generate sales in their countries, and we consolidate their results in our financial statements. Our joint venture interests include China, Malaysia and Singapore (50%), Thailand and Israel (51%), Mexico (60%), and South Korea (65%). Where we do not sell directly through our international subsidiaries and joint ventures, our footwear is distributed through a network of distributors and licensees who sell our products to department, athletic and specialty stores.
Wholesale. Our Wholesale segment primarily comprises sales to a vast network of partners. These include: department stores, family shoe stores, specialty running and sporting goods retailers, and big box club stores; franchisee and licensee third-party store operators representing approximately 3,100 Skechers branded stores worldwide; dedicated e-commerce retailers; and international distributors.
Direct-to-Consumer. Our Direct-to-Consumer segment primarily comprises sales by Skechers directly to consumers through a combination of channels. These include approximately 1,450 company-owned retail stores in formats consisting of concept, factory outlet and big box; digital commerce sites and mobile applications; and hosted direct-to-consumer sales through marketplaces in select international markets
We pursue our direct-to-consumer strategy through our integrated retail formats, which enable us to promote the full Skechers product offering in an attractive environment that appeals to a broad group of consumers.
|
|
• |
E-commerce – Our company-owned e-commerce business enables consumers to shop, browse, find store locations, socially interact, post reviews, and immerse themselves in our brands. Additionally, the e-commerce business provides an efficient and effective retail distribution channel, which continues to improve our customer service and brand experience. |
|
|
• |
Concept Stores – Our concept stores are located at high street locations, major tourist areas or in key shopping malls in metropolitan cities. Our concept stores serve as a showcase for a wide range of our product offering. Retail locations are generally chosen to generate maximum marketing value for the Skechers brand name through signage, store front presentation and interior design. These stores also serve as product testing venues. |
|
|
• |
Factory Outlet Stores – Our factory outlet stores are generally located in manufacturers’ direct outlet centers in the U.S. and in select international markets. Our factory outlet stores provide opportunities for us to sell discontinued and excess merchandise. |
4
|
|
• |
Big Box Stores – Our free-standing and attached big box stores, which are primarily located throughout the U.S. and Canada, enable us to liquidate excess merchandise, discontinued lines and odd-size inventory. |
Store count, openings and closings for our domestic, international and third-party stores are as follows:
|
|
|
Number of locations |
|
|
|
|
December 31 2021 |
|
|
Opened |
|
|
Closed(1) |
|
|
December 31, 2022 |
|
|
Domestic stores |
|
|
515 |
|
|
|
43 |
|
|
|
(19 |
) |
|
|
539 |
|
|
International stores |
|
|
845 |
|
|
|
172 |
|
|
|
(112 |
) |
|
|
905 |
|
|
Distributor, licensee and franchise stores |
|
|
2,946 |
|
|
|
529 |
|
|
|
(382 |
) |
|
|
3,093 |
|
|
Total Skechers stores |
|
|
4,306 |
|
|
|
744 |
|
|
|
(513 |
) |
|
|
4,537 |
|
|
|
(1) |
Does not reflect temporary closures due to the COVID-19 pandemic.
|
LICENSING
We believe that selective licensing of the Skechers brand name and our product line names to manufacturers broadens and enhances the individual brands without requiring significant capital investments or additional incremental operating expenses. Our multiple product lines plus additional subcategories present many potential licensing opportunities on terms that we believe will provide more effective manufacturing, distribution or marketing of non-footwear products.
As of December 31, 2022, we had 27 active licensing agreements in which we are the licensor. We license a variety of Skechers-branded products including apparel, accessories, socks and eyewear; medical scrubs; fitness and yoga accessories, and cold weather products. Additional category-specific collections include Skechers Sport apparel, bags, backpacks and headwear; Twinkle Toes backpacks and lunchboxes; BOBS from Skechers socks and backpacks; and Skechers Work socks. We also have BOBS from Skechers pet accessories in Petco.
DISTRIBUTION FACILITIES AND OPERATIONS
We believe that strong distribution support is a critical factor in our operations. Our distribution network includes (i) an approximately 2.6 million square-foot North American distribution center located in California, (ii) an approximately 2.2 million square-foot European distribution center located in Belgium, (iii) an approximately 1.6 million square foot China distribution center, (iv) an approximately 0.3 million square foot United Kingdom distribution center, (v) company-operated distribution centers or third-party distribution centers in Central America, South America and Asia, and (vi) third-party manufacturers and other international third-party distribution centers.
INTELLECTUAL PROPERTY RIGHTS
We own and utilize a variety of trademarks, including the Skechers trademark. We have a significant number of both registrations and pending applications for our U.S. trademarks. In addition, we have trademark registrations and trademark applications in 162 foreign countries. We have design patents and pending design and utility patent applications in both the U.S. and 39 foreign countries. We continuously look to increase the number of our patents and trademarks both domestically and internationally, where necessary to protect our intellectual property. We regard our trademarks and other intellectual property as valuable assets and believe that they have significant value in marketing our products. We vigorously protect our trademarks against infringement, including through the use of cease and desist letters, administrative proceedings and lawsuits.
COMPETITION
The global footwear industry is a competitive business. Although we believe that we do not compete directly with any single company with respect to its entire range of products, our products compete with other branded products within their product category as well as with private label products sold by retailers, including some of our customers. We also compete with numerous manufacturers, importers and distributors of footwear for the limited shelf space available for displaying such products to the consumer. Moreover, the general availability of contract manufacturing capacity allows ease of access by new market entrants. Some of our competitors are larger, have been in existence for a longer period of time, have strong brand recognition, have captured greater market share and/or have substantially greater financial, distribution, marketing and other resources than we do.
HUMAN CAPITAL
As of December 31, 2022, we employed approximately 15,100 persons, of whom approximately 7,800 were employed on a full-time basis and approximately 7,300 were employed on a part-time basis, primarily in our retail stores.
Social Responsibility. As a family-focused brand, Skechers was founded on inclusivity, diversity, respect and entrepreneurial spirit with the philosophy of putting people first – offering comfort and care to our employees and customers. In conjunction with our policy against discrimination, Skechers emphasizes that every employee, applicant, contractor and customer is entitled to be treated with dignity and respect. Human rights is a core value at the heart of how we conduct our business, at every level of the Company – including our factories and suppliers. All full-time and part-time corporate employees in the U.S. undergo harassment and diversity training, and
5
employees of our wholly-owned operations in other countries comply with their local laws regarding human rights, harassment and diversity training in the workplace. As it relates to our factories and suppliers specifically, we provide employee and management training to ensure that employees and companies who oversee our production and manufacturer auditing know the most current issues regarding human rights. Our Code of Ethics, Corporate Code of Conduct and Supplier Code of Conduct codify these values and our commitment to diversity, equity and inclusion. These codes are in the Corporate Governance section of the Investor Relations page of our corporate information website located at https://investors.skechers.com/corporate-governance/governance-documents. We intend to post any amendment to, or waivers of, these codes on our website. The information found on, or otherwise accessible through our website, is not incorporated into, and does not form a part of this annual report.
Skechers is focused on reducing its carbon footprint. We have made environmental advancements a top priority at our corporate facilities. Now under construction, our expanding corporate offices remain future-focused as we incorporate our earth-friendly philosophy into our growing footprint. All four corporate buildings are being designed to receive LEED Gold certification upon completion, and include solar panels.
Community. Skechers encourages active participation in the greater community, with annual charity walks for children in the U.S. and around the world. We promote charitable giving and volunteering by sponsoring community service days along with blood drives, food drives, and shoe drives. Additionally, we regularly donate product to not-for-profit organizations. In 2022, the Company donated over 105,000 pairs of new shoes to those in need, more than $1.5 million to Petco Love Foundation to help save the lives of animals in need in the U.S. and Canada.
Health and Safety. Skechers’ lifestyle and performance product offering has shaped our culture with a focus on wellness, and a commitment to providing a safe and healthful work environment for all employees. The Company offers healthy lunch options, an in-house fitness consultant and corporate exercise programs. We offer paid time off to get the COVID-19 vaccine and provided on-site vaccination clinics for our corporate employees and our domestic distribution center employees. We made changes to our corporate facilities, increasing cleaning protocols and distributing personal protective equipment and cleaning supplies to employees; installing touchless doors and faucets in common areas.
Talent. We offer competitive benefits in a casual, creative atmosphere and a fun, fast-paced environment where employees can always learn and grow. Employee benefits are designed to help employees and their families stay healthy, meet their financial goals, and help them balance their work and personal lives. Benefits include health and wellness programs, training and development programs, an employee stock purchase program, a childcare incentive program, on-site electric vehicle charging stations, and product discounts.
In addition to the other information in this annual report, the following factors should be considered in evaluating us and our business.
RISKS RELATED TO OUR BUSINESS AND INDUSTRY
Our Future Success Depends On Our Ability To Maintain Our Brand Name And Image With Consumers.
Our success to date has largely been due to the strength of the Skechers brand. Maintaining, promoting, and growing our brand depends on our ability to develop high-quality, innovative, and fashion forward products, as well as our ability to create fresh and relevant marketing and advertising campaigns. The inability to execute or adverse developments in these areas could negatively impact our brand. Our brand could also be negatively impacted if we or any of our products were to receive negative publicity of any kind. If we are unable to maintain, promote and grow our brand, then our business, financial condition, results of operations, and cash flows could be materially and adversely affected.
Our Future Success Also Depends On Our Ability To Respond To Changing Consumer Preferences, Identify And Interpret Consumer Trends, And Successfully Market New Products.
The footwear industry is subject to rapidly changing consumer preferences. The continued popularity of our footwear requires us to accurately identify changing consumer preferences and effectively respond in a timely manner. Demand for and market acceptance of existing and new products are uncertain and depend on the following factors:
|
|
• |
substantial investment in product innovation, design and development; |
|
|
• |
commitment to product quality; and |
|
|
• |
significant and sustained marketing efforts and expenditures, including with respect to the monitoring of consumer trends. |
We are often required to make decisions about product designs and marketing expenditures several months in advance of when consumer acceptance can be determined. As a result, we may not be successful in responding to shifting consumer preferences with new products that achieve market acceptance. If we fail to identify and effectively respond to changing consumer preferences, we could experience excess inventories, higher than normal markdowns, returns, order cancellations or an inability to profitably sell our products, and our business, financial condition, results of operations, and cash flows could be materially and adversely affected.
6
We Face Intense Competition, Including Competition From Companies In The Performance Footwear Market and With Significantly Greater Resources Than Ours, And If We Are Unable To Compete Effectively, Our Market Share May Decline And Our Business Could Be Harmed.
We face intense competition from other established companies in the footwear industry in the areas of product offerings, pricing, costs of production, and advertising and marketing expenditures. Consumer demand for our products may decline significantly if we do not adequately and timely anticipate and respond to our competitors. Some of our competitors have significantly greater financial, technological, engineering, manufacturing, marketing and distribution resources than we do. Their greater capabilities in these areas may enable them to better withstand periodic downturns in the footwear industry, compete more effectively on price and production, more effectively keep up with rapid changes in footwear technology, and more quickly develop new products. New companies may also enter the markets in which we compete, further increasing competition. In addition, negative consumer perceptions of our performance features due to our historical reputation as a fashion and lifestyle footwear company may place us at a competitive disadvantage in the performance footwear market. We may not be able to compete successfully in the future, and increased competition may result in price reductions, cost increases, reduced profit margins, loss of market share and an inability to generate cash flows that are sufficient to maintain or expand our development and marketing of new products, which would materially adversely impact our business, results of operations and financial condition.
Our Strategies Involve A Number Of Risks That Could Prevent Or Delay The Successful Opening Of New Stores As Well As Negatively Impact The Performance Of Our Existing Stores.
Our ability to successfully open and operate new stores depends on many factors, including our ability to identify suitable store locations, the availability of which is outside of our control; negotiate acceptable lease terms, including desired tenant improvement allowances; source sufficient levels of inventory to meet the needs of new stores; hire, train and retain store personnel; successfully integrate new stores into our existing operations; and satisfy the fashion preferences in new geographic areas.
In addition, new stores could be opened in regions in which we currently have few or no stores. Any expansion into new markets may present competitive, merchandising and distribution challenges that are different from those we encounter in our existing markets. Any of these challenges could adversely affect our business and results of operations. In addition, any new store openings in existing markets could result in reduced sales in existing stores in those markets. We may decide to close stores that experience sales declines, which could result in additional costs, expenses, asset impairments or asset write-downs.
Our Global Retail Business Has Required, And Will Continue To Require, A Substantial Investment And Commitment Of Resources And Is Subject To Numerous Risks And Uncertainties.
Our global retail business has required substantial investments in leasehold improvements, inventory, and personnel. We have also made significant operating lease commitments for retail space worldwide. Due to the high fixed-cost structure associated with our global retail business, the poor performance or closure of stores could result in significant lease termination costs, write-offs or impairments of leasehold improvements, and employee-related termination costs. The success of our global retail operations also depends on our ability to identify and adapt to changes in consumer spending patterns and retail shopping preferences globally, including the shift from brick and mortar to digital and mobile channels. Our failure to successfully respond to these factors could adversely affect our retail business, as well as damage our brand and reputation, and could materially affect our results of operations, financial position, and cash flows.
Many Of Our Retail Stores Depend Heavily On The Customer Traffic Generated By Shopping And Factory Outlet Malls Or By Tourism.
Many of our concept stores are in shopping malls and some of our factory outlet stores are in manufacturers’ outlet malls. We depend on obtaining prominent locations and the overall success of the malls to generate customer traffic. The overall success of the malls can be negatively impacted by factors outside of our control, such as store closures by other retailers. Some of our concept stores occupy street locations that are heavily dependent on customer traffic generated by tourism. Tourism can be adversely affected by external factors such as an economic slowdown or social or political events. Any substantial decrease in customer traffic generated by malls or tourism has, and may continue to have, an adverse effect on sales in our existing stores or hinder our ability to open retail stores in new markets, which could negatively affect our operating results.
We Depend On Key Personnel To Manage Our Business Effectively In A Rapidly Changing Market, And If We Are Unable To Retain Existing Personnel, Our Business Could Be Harmed.
Our future success depends upon the continued services of Robert Greenberg, Chairman of the Board and Chief Executive Officer; Michael Greenberg, President and a member of our Board of Directors; and David Weinberg, Executive Vice President, Chief Operating Officer and a member of our Board of Directors. The loss of the services of any of these individuals or any other key employee could harm us. Our future success also depends on our ability to identify, attract and retain additional qualified personnel. Competition for employees in our industry is intense, and we may not be successful in attracting and retaining such personnel.
7
We Have A Significant Work Force And Are Subject To Risks Related To Human Capital Management.
We employ approximately 15,100 employees worldwide and a significant portion of our operating expenses relate to compensation and benefits. Although we spend a significant amount of time and expense on human capital management, we cannot ensure that we will be able to maintain a happy and productive workforce. If we are unable to offer competitive compensation and benefits, appropriate training and development, and a compelling work environment or sustain employee satisfaction, our culture may be adversely affected, our reputation may be damaged, and we may incur costs related to turnover.
RISKS RELATED TO SUPPLY CHAIN
Our Business Could Be Harmed If We Fail To Maintain Proper Inventory Levels.
We place orders with our manufacturers for some of our products prior to the time we receive all our customers’ orders. We do this to minimize purchasing costs, the time necessary to fill customer orders, and the risk of non-delivery. We also maintain an inventory of certain products that we anticipate will be in greater demand. Any unanticipated decline in the popularity of Skechers footwear or other unforeseen circumstances may make it difficult for us and our customers to accurately forecast demand, and we may be unable to sell the products we have ordered in advance from manufacturers or that we have in our inventory. Inventory levels exceeding customer demand may result in inventory write-downs and the sale of excess inventory at discounted prices, which could significantly impair our brand image and have a material adverse effect on our operating results, financial condition and cash flows. Conversely, if we underestimate consumer demand for our products or if our manufacturers fail to supply products when we need them, we may experience inventory shortages. Inventory shortages might delay shipments to customers, negatively impact retailer and distributor relationships, and diminish brand loyalty.
Our International Sales And Manufacturing Operations Are Subject To The Risks Of Doing Business Abroad, Particularly In China and Vietnam, Which Could Affect Our Ability To Manufacture Or Sell Our Products, Obtain Products From Foreign Suppliers Or Control The Costs Of Our Products.
Substantially all our sales during the year ended December 31, 2022 were derived from sales of footwear manufactured in foreign countries, with most manufactured in China and Vietnam. We also sell our footwear in several foreign countries and plan to increase our international sales efforts as part of our growth strategy. Foreign manufacturing and sales are subject to a number of risks, including the following: political and social unrest, including terrorism; changing economic conditions, including higher labor costs; increased costs of raw materials; currency exchange rate fluctuations; labor shortages and work stoppages, including those due to the outbreak of a disease leading to an epidemic or pandemic spread; electrical shortages; transportation delays; loss or damage to products in transit; expropriation; nationalization; the adjustment, elimination or imposition of domestic and international duties, tariffs, quotas, import and export controls and other non-tariff barriers; exposure to different legal standards (particularly with respect to intellectual property); compliance with foreign laws; changes in domestic and foreign governmental policies; and the potential for circumstances where we may have to incur premium freight charges to expedite the delivery of product to our customers. If we incur a significant amount of premium charges to airfreight product for our customers and we are not able to collect those charges, our gross profit will be negatively affected. Apart from the impacts of the COVID-19 pandemic, including supply chain constraints, we have not, to date, been materially affected by any such risks, but we cannot predict the likelihood of such developments occurring or the resulting long-term adverse impact on our business, results of operations, financial condition and cash flows.
In particular, because most of our products are manufactured in China and Vietnam, the possibility of adverse changes in trade or political relations with China or Vietnam, political instability in China or Vietnam, increases in labor costs, the occurrence of prolonged adverse weather conditions or a natural disaster such as an earthquake or typhoon in China or Vietnam, or the outbreak of a pandemic disease in China or Vietnam could severely interfere with the manufacturing and/or shipment of our products and would have a material adverse effect on our operations. Our business operations may be adversely affected by the current and future political environment in the People’s Republic of China (“PRC”). The government of the PRC has exercised and continues to exercise substantial control over virtually every sector of the Chinese economy through regulation and state ownership. Our ability to operate under the PRC may be adversely affected by changes in Chinese laws and regulations, including those relating to taxation, import and export tariffs, raw materials, environmental regulations, land use rights, property and other matters. Under its current leadership, the government of the PRC has been pursuing economic reform policies that encourage private economic activity and greater economic decentralization. There is no assurance, however, that the government of the PRC will continue to pursue these policies, or that it will not significantly alter these policies from time to time without notice. A change in policies by the PRC government could adversely affect our interests by, among other factors: changes in laws, regulations or the interpretation thereof, confiscatory taxation, restrictions on currency conversion, imports or sources of supplies, or the expropriation or nationalization of private enterprises.
We Rely On Independent Contract Manufacturers And, As A Result, Are Exposed To Disruptions In Product Supply.
Our footwear products are currently manufactured by independent contract manufacturers. During the year ended December 31, 2022, the top five manufacturers of our products produced approximately 39.0% of our total purchases. One manufacturer accounted for 16.5% of total purchases for the year ended December 31, 2022.
8
We compete with other footwear companies for production facilities, and we do not have long-term contracts with any of our contract manufacturers. Under our current arrangements with them, these manufacturers generally may unilaterally terminate their relationship with us at any time. If our current manufacturers cease doing business with us, we could experience an interruption in the manufacture of our products. Although we believe that we could find alternative manufacturers, we may be unable to establish relationships with alternative manufacturers that will be as favorable as the relationships we have now. For example, new manufacturers may have higher prices, less favorable payment terms, lower manufacturing capacity, lower quality standards or higher lead times for delivery. If we are unable to provide products consistent with our standards or the manufacture of our footwear is delayed or becomes more expensive, our business and financial condition would be harmed.
While not a material issue as of the filing date of this report, the COVID-19 pandemic previously led to the Chinese and Vietnamese governments imposing temporary closures of some of our factories in China and restrictions on others in Vietnam that caused delays in shipment of our products. We may encounter similar challenges yet again with these manufacturers, or new difficulties could arise with our manufacturers or any raw material suppliers on which our manufacturers rely, including prolonged manufacturing or transportation disruptions due to public health conditions, such as the recent COVID-19 pandemic, reductions in the availability of production capacity due to government imposed restrictions, failure to meet our quality control standards, failure to meet production deadlines or increased manufacturing costs. This could result in our customers canceling orders, refusing to accept deliveries or demanding reductions in purchase prices, any of which could have a negative impact on our cash flows and harm our business and results of operations.
Our Ability To Deliver Our Products To The Market Could Be Disrupted If We Encounter Problems Affecting Our Logistics And Distribution Systems.
We rely on owned or independently operated distribution facilities to transport, warehouse and ship products to our customers. Our logistics and distribution systems include computer-controlled and automated equipment, which may be subject to risks related to security or computer viruses, the proper operation of software and hardware, power interruptions or other system failures. Substantially all our products are distributed from a few locations. Therefore, our operations could be interrupted by travel restrictions, earthquakes, floods, fires or other natural disasters near our distribution centers. Our business interruption insurance may not adequately protect us from the potential adverse effects of significant disruptions to our distribution system, such as the long-term loss of customers or an erosion of brand image. In addition, our distribution capacity is dependent on the timely performance of services by third parties, including the transportation of product to and from our distribution facilities. If we encounter problems affecting our distribution system, our ability to meet customer expectations, manage inventory, complete sales, and achieve operating efficiencies could be materially adversely affected.
RISKS RELATED TO ECONOMIC AND POLITICAL CONDITIONS, PANDEMICS AND OTHER EXTERNAL FACTORS
The Uncertainty Of Global Market Conditions May Continue To Have A Negative Impact On Our Business, Results Of Operations Or Financial Condition.
The uncertain state of global economic and political conditions, including the impact of inflation and challenging consumer retail market, may negatively impact our business, which depends on the general economic environment and levels of consumers’ discretionary spending. If the current economic situation does not improve or if it weakens, we may not be able to maintain or increase our sales to existing customers, make sales to new customers, open and operate new retail stores, maintain sales levels at our existing stores, maintain or increase our international operations on a profitable basis, or maintain or improve our earnings from operations as a percentage of sales. Additionally, if there is an unexpected decline in sales, our results of operations will depend on our ability to implement a corresponding and timely reduction in our costs and manage other aspects of our operations. These challenges include (i) managing our infrastructure, (ii) hiring and maintaining, as required, the appropriate number of qualified employees, (iii) managing inventory levels and (iv) controlling other expenses.
Russia’s ongoing war with Ukraine and the subsequent economic sanctions imposed by the U.S., NATO and other countries may impact global economic conditions or our ability to sell products to customers in the affected regions. The conflict could also have broader implications on economics outside the region, such as the global inflationary impact of a potential boycott of Russian oil and gas by other countries. Furthermore, any unfavorable developments in global political, social and regulatory conditions, including geopolitical conflicts, political unrest, civil strife, terrorist activity, acts of war, public corruption, expropriation, nationalism and other economic or political uncertainties in the U.S. or internationally, could also impact our business. Any negative sentiment toward the U.S. as a result of any such developments could also adversely affect our business and reputation. If the uncertain global market conditions continue for a significant period or worsen, our results of operations, financial condition, and cash flows could be materially adversely affected.
9
Our Business Could Be Adversely Affected By Changes In The Business Or Financial Condition Of Our Customers Due To Global Economic Conditions.
A global financial crisis could affect the banking system and financial markets and result in a tightening in the credit markets, more stringent lending standards and terms, higher inflation, and higher volatility in fixed income, credit, currency and equity markets. In addition, our business could be adversely affected by other economic conditions, such as the insolvency of certain of our key distributors, which could impair our distribution channels, or the diminished liquidity or an inability to obtain credit to finance purchases of our product by our significant customers. Our customers may also experience weak demand for our products or other difficulties in their businesses. If economic, financial or political conditions in global markets deteriorate in the future, demand may be lower than forecasted and insufficient to achieve our anticipated financial results. Any of these events would likely harm our business, results of operations, financial condition and cash flows.
Natural Disasters, The Effects Of Climate Change, Pandemics, Including the COVID-19 Pandemic, And Other Events Beyond Our Control Could Have A Material Adverse Effect On Our Business And Results Of Operations.
Natural disasters or other catastrophic events may cause damage or disruption to our operations, international commerce, and the global economy, and thus could have a negative effect on us. Our business operations are subject to interruption from earthquakes, hurricanes, tornadoes, floods, fires, extreme weather events, power shortages, pandemics such as COVID-19, terrorism, political unrest, telecommunications failure, vandalism, cyber-attacks, geopolitical instability, war, the effects of climate change, and other events beyond our control. Although we maintain disaster recovery plans, such events could disrupt our operations or those of our customers and suppliers, including through the inability of employees and contract professionals to work, destruction of facilities, loss of life, and adverse effects on supply chains, power, infrastructure and the integrity of information technology systems, all of which could materially increase our costs and expenses, delay or decrease revenue from our customers and disrupt our ability to maintain business continuity. We could incur significant costs to improve the climate-related resiliency of our infrastructure and otherwise prepare for, respond to, and mitigate the effects of climate changes. Our insurance may not be sufficient or cover losses or additional expenses that we may sustain. A significant natural disaster or other event that disrupts our operations or those of our customers or suppliers could have a material adverse effect on our business, results of operations, financial condition, and prospects.
Our business relies heavily on the health and safety of our employees, contract professionals and customers. The impact of a health crisis such as the COVID-19 pandemic on our business, operations, and future financial performance could include, but is not limited to, adverse impacts to our operating income, operating margin, net income, earnings per share and operating cash flows, as expenses may not decrease at the same rate as revenues decline. In addition, our quarterly and annual revenue growth rates and expenses as a percentage of our revenues may differ significantly from our historical rates, and our future operating results may fall below expectations.
Our Sales Are Influenced By Economic Conditions And Uncertainty That Impact Consumer Spending And Consumer Confidence.
Consumer confidence and spending on discretionary items generally declines during periods of economic uncertainty or recession. Our wholesale customers anticipate and respond to adverse changes in economic conditions and uncertainty by reducing inventories and/or increasing promotional activity. Our retail stores are also affected by these conditions and may experience declines in consumer traffic and spending. As a result, factors that diminish consumer confidence and spending, particularly deterioration in general economic conditions, consumer credit availability, consumer debt levels, inflation, the impact of foreign exchange fluctuations on tourism and tourist spending, volatility in investment returns, fear of unemployment, increases in energy costs or taxes or interest rates, housing market downturns, fear about and impact of pandemic illness (such as the impact of the COVID-19 pandemic), and other factors such as acts of war, natural disasters or terrorist or political events that impact consumer confidence, have had, and may continue to have (with respect to the COVID-19 pandemic), a material adverse effect on our operations and financial condition through their negative impact on our wholesale customers as well as decreased spending in our retail stores and potentially via our e-commerce business.
Natural Disasters Or A Decline In Economic Conditions In California Could Increase Our Operating Expenses Or Adversely Affect Our Sales Revenue.
A substantial portion of our operations are in California, including 96 of our retail stores, our headquarters in Manhattan Beach, and our North America distribution center in Rancho Belago. A decline in the economic conditions in California could have a material adverse impact on our business. Furthermore, a natural disaster or other catastrophic event in California, such as an earthquake or wildfire, could significantly disrupt our business including the operation of our only domestic distribution center. We may be more susceptible to these issues than our competitors whose operations are not as concentrated in California.
10
Our Environmental, Social And Governance (“ESG”) Commitments and Disclosures May Expose Us To Reputational Risks And Legal Liability.
Our brand and reputation are associated with our public commitments to various corporate ESG initiatives, including our goals relating to sustainability and diversity and inclusion. Our disclosures on these matters and any failure or perceived failure to achieve or accurately report on our commitments, could harm our reputation and adversely affect our client relationships or our recruitment and retention efforts, as well as expose us to potential legal liability. Increasing focus on ESG matters has resulted in, and is expected to continue to result in, the adoption of legal and regulatory requirements designed to mitigate the effects of climate change on the environmental, as well as legal and regulatory requirements requiring climate-related disclosures. If new laws or regulations are more stringent than current legal or regulatory requirements, we may experience increased compliance burdens and costs to meet such obligations. Our selection of voluntary disclosure frameworks and standards, and the interpretation or application of those frameworks and standards, may change from time to time or may not meet the expectations of investors or other stakeholders. Our processes and controls for reporting ESG matters across our operations and supply chain are evolving along with multiple disparate standards for identifying, measuring, and reporting ESG metrics, including ESG-related disclosures that may be required by the SEC, European and other regulators, and such standards may change over time, which could result in significant revisions to our current goals, reported progress in achieving such goals, or ability to achieve such goals in the future.
RISKS RELATED TO CURRENCY EXCHANGE RATES
Foreign Currency Exchange Rate Fluctuations Could Have A Material Adverse Effect On Our Business And Results Of Operations.
Foreign currency fluctuations affect our revenue and profitability. Changes in currency exchange rates may impact our financial results positively or negatively in one period and not another, which may make it difficult to compare our operating results from different periods. Currency exchange rate fluctuations may also adversely impact third parties that manufacture our products by making their costs of raw materials or other production costs more expensive and more difficult to finance, thereby raising prices for us, our distributors and/or our licensees. We do not currently engage in hedging activities with respect to these currency exchange rate risks. For a more detailed discussion of the risks related to foreign currency fluctuation, see Item 7A: “Quantitative and Qualitative Disclosures About Market Risk.”
In addition, our foreign subsidiaries purchase products in U.S. dollars, which causes the cost of those products to vary depending on the foreign currency exchange rates and impacts the price charged to customers. Our foreign distributors also purchase products in U.S. dollars and sell in local currencies, which impacts the price to foreign consumers. As the U.S. dollar strengthens relative to foreign currencies, our revenues and profits are reduced when translated into U.S. dollars and our margins may be negatively impacted by the increase in product costs due to foreign currency exchange rates. Although we typically work to mitigate the impact of exchange rate fluctuations through price increases and further actions to reduce costs, we may not be able to fully offset the impact, if at all. Our success depends, in part, on our ability to manage or mitigate these foreign currency impacts, as changes in the value of the U.S. dollar relative to other currencies could have a material adverse effect on our business, results of operations, financial position and cash flows.
RISKS RELATED TO LEGAL AND REGULATORY MATTERS
Changes In Tax Laws Or The Potential Imposition Of Additional Duties, Quotas, Tariffs And Other Trade Restrictions Could Have An Adverse Impact On Our Sales And Profitability.
All our products manufactured overseas and imported into the U.S., the European Union and other countries are subject to customs duties. We are unable to predict whether there may be unfavorable changes in tax laws in the U.S. or overseas, additional customs duties, quotas, tariffs, anti-dumping duties, safeguard measures, cargo restrictions to prevent terrorism or other trade restrictions imposed on the importation of our products in the future. Such actions could adversely affect our ability to produce and market footwear at competitive prices and might have an adverse impact on our sales and results of operations.
Changes To U.S. Or Other Countries’ Trade Policies And Import/Export Regulations Or Our Failure To Comply With Such Regulations May Have A Material Effect On Our Reputation, Business, Financial Condition And Results Of Operations.
Changes in laws and policies governing foreign trade, manufacturing, development and investment in the territories or countries where we currently sell our products or conduct our business could adversely affect our business. U.S. presidential administrations have instituted or proposed changes in trade policies that include the negotiation or termination of trade agreements, the imposition of higher tariffs on imports into the U.S., economic sanctions on individuals, corporations or countries, and other government regulations affecting trade between the U.S. and other countries where we conduct our business. It may be time-consuming and expensive for us to alter our business operations in order to adapt to or comply with any such changes.
11
In addition, changes or proposed changes in U.S. or other countries' trade policies may result in restrictions and economic disincentives on international trade. Tariffs and other changes in U.S. trade policy have in the past and could in the future trigger retaliatory actions by affected countries, and certain foreign governments have instituted or are considering imposing retaliatory measures on certain U.S. goods. Further, any emerging protectionist or nationalist trends either in the U.S. or in other countries could affect the trade environment. The Company, similar to many other multinational corporations, does a significant amount of business that would be impacted by changes to the trade policies of the U.S. and foreign countries (including governmental action related to tariffs, international trade agreements, or economic sanctions). Such changes have the potential to adversely impact the U.S. economy or certain sectors thereof or the economy of another country in which we conduct operations, our industry and the global demand for our products, and as a result, could have a material adverse effect on our business, financial condition and results of operations
Our Business Could Be Harmed If Our Contract Manufacturers, Suppliers Or Licensees Violate Labor, Trade Or Other Laws.
We require our independent contract manufacturers, suppliers and licensees to operate in compliance with applicable laws and regulations. Manufacturers are required to certify that neither convicted, forced or indentured labor (as defined under U.S. law) nor child labor (as defined by law in the manufacturer’s country) is used in the production process, that compensation is paid in accordance with local law and that their factories are in compliance with local safety regulations. Although we promote ethical business practices and our sourcing personnel periodically visit and monitor the operations of our independent contract manufacturers, suppliers and licensees, we do not control them or their labor practices. If one of our independent contract manufacturers, suppliers or licensees violates labor or other laws or diverges from those labor practices generally accepted as ethical in the U.S., it could result in adverse publicity for us, damage our reputation in the U.S., or render our conduct of business in a particular foreign country undesirable or impractical, any of which could harm our business.
In addition, if we, or our foreign manufacturers, violate U.S. or foreign trade laws or regulations, we may be subject to extra duties, significant monetary penalties, the seizure and the forfeiture of the products we are attempting to import, or the loss of our import privileges. Possible violations of U.S. or foreign laws or regulations could include inadequate record-keeping of our imported products, misstatements or errors as to the origin, quota category, classification, marketing or valuation of our imported products, fraudulent visas, or labor violations. The effects of these factors could render our conduct of business in a particular country undesirable or impractical, and have a negative impact on our operating results.
The Disruption, Expense And Potential Liability Associated With Existing And Unanticipated Future Litigation Against Us Could Have A Material Adverse Effect On Our Business, Results Of Operations, Financial Condition And Cash Flows.
In addition to the legal matters included in our reserve for loss contingencies, we occasionally become involved in litigation arising from the normal course of business, and we are unable to determine the extent of any liability that may arise from any such unanticipated future litigation. We have no reason to believe that there is a reasonable possibility or a probability that we may incur a material loss, or a material loss in excess of a recorded accrual, with respect to any other such loss contingencies. However, the outcome of litigation is inherently uncertain and assessments and decisions on defense and settlement can change significantly in a short period of time. Therefore, although we consider the likelihood of such an outcome to be remote with respect to those matters for which we have not reserved an amount for loss contingencies, if one or more of these legal matters were resolved against us in the same reporting period for amounts in excess of our expectations, our consolidated financial statements of a particular reporting period could be materially adversely affected. Further, any unanticipated litigation in the future, regardless of its merits, could also significantly divert management’s attention from our operations and result in substantial legal fees being incurred. Such disruptions, legal fees and any losses resulting from these unanticipated future claims could have a material adverse effect on our business or financial condition.
Our Ability To Compete Could Be Jeopardized If We Are Unable To Protect Our Intellectual Property Rights Or If We Are Sued For Intellectual Property Infringement.
We believe that our trademarks, design patents and other proprietary rights are important to our success and our competitive position. We use trademarks on nearly all our products and believe that having distinctive marks that are readily identifiable is an important factor in creating a market for our goods, in identifying us and in distinguishing our goods from the goods of others. We consider our Skechers®, Skechers Slip-ins® Skechers Hands Free Slip-ins®, Skechers Performance™, Skechers GOrun®, Skechers GOwalk®, Skechers GO golf®, Skechers GOtrain®, Skechers on-the-GO®,  ®,
®,  ®,
®,  ®,
®,  ®,
®,  ®, Skechers Cali®, Skechers Street™, Skechers USA®, Skechers Active™, Skechers Sport Active™, Skechers Work™, Max Cushioning®, Massage Fit®, Mark Nason®, D’Lites®, DLT-A®, BOBS®, Glide Step®, Skech-Air®, Skechers Kids™, Twinkle Toes®, S Lights®, Relaxed Fit®, Arch Fit®, Ultra GO®, Hyper Burst®, Skechers Memory Foam™, and Air-cooled Memory Foam® trademarks to be among our most valuable assets, and we have registered these trademarks in many countries. In addition, we own many other trademarks that we utilize in marketing our products. We also have a number of design patents and utility patents covering components and features used in various shoes. We believe that our patents and trademarks are sufficient to permit us to carry on our business as presently conducted. While we vigorously protect our trademarks against infringement, we cannot guarantee that we will be able to secure patents or trademark protection for our intellectual property in the future or that protection will be adequate for future products. Further, we have been sued in the past for patent and trademark infringement and cannot be sure that our activities do not and will not infringe on the intellectual property rights of others. If we are compelled to prosecute infringing parties, defend our intellectual property or defend ourselves from intellectual property claims made
12
by others, we may face significant expenses and liability as well as the diversion of management’s attention from our business, which could negatively impact our business or financial condition.
In addition, the laws of foreign countries where we source and distribute our products may not protect intellectual property rights to the same extent as do the laws of the U.S. We cannot be assured that the actions we have taken to establish and protect our trademarks and other intellectual property rights outside the U.S. will be adequate to prevent imitation of our products by others or, if necessary, successfully challenge another party’s counterfeit products or products that otherwise infringe on our intellectual property rights on the basis of trademark or patent infringement. Continued sales of counterfeit products could adversely affect our sales and our brand and result in the shift of consumer preference away from our products. We may face significant expenses and liability in connection with the protection of our intellectual property rights outside the U.S., and if we are unable to successfully protect our rights or resolve intellectual property conflicts with others, our business or financial condition could be adversely affected.
Breaches Or Compromises Of Our Information Security Systems, Information Technology Systems And Our Infrastructure To Support Our Business Could Result In Exposure Of Private Information, Disruption Of Our Business And Damage To Our Reputation, Which Could Harm Our Business, Results Of Operation And Financial Condition.
As a routine part of our business, we utilize information security and information technology systems and websites that allow for the secure storage and transmission of proprietary or private information regarding our customers, employees, vendors and others. A security breach of our network, hosted service providers, or vendor systems, may expose us to a risk of loss or misuse of this information, litigation and potential liability. Hackers and data thieves are increasingly sophisticated and operate large-scale and complex automated attacks, and the retail industry, has been the target of many recent cyber-attacks. Although we take measures to safeguard this sensitive information, we may not have the resources or technical sophistication to anticipate or prevent rapidly evolving types of cyber-attacks targeted at us, our customers, or others who have entrusted us with information. Actual or anticipated attacks may cause us to incur costs, including costs to deploy additional personnel and protection technologies, train employees, and engage third-party experts and consultants.
We invest in industry standard security technology to protect personal information. Advances in computer capabilities, new technological discoveries, or other developments may result in the technology used by us to protect against transaction or other data being breached or compromised. In addition, data and security breaches can also occur due to non-technical issues, including breach by us or by persons with whom we have commercial relationships that result in the unauthorized release of personal or confidential information. Although we maintain insurance designed to provide coverage for cyber risks related to what we believe to be adequate and collectible insurance in the event of theft, loss, fraudulent or unlawful use of customer, employee or company data, any compromise or breach of our cyber security systems could result in private information exposure and a violation of applicable privacy and other laws, significant potential liability including legal and financial costs, and loss of confidence in our security measures by customers, which could result in damage to our brand and have an adverse effect on our business, financial condition and reputation. In addition, we must comply with increasingly complex and rigorous regulatory standards enacted to protect business and personal data. Compliance with existing and proposed laws and regulations can be costly, and any failure to comply with these regulatory standards could subject us to legal and reputational risks. Misuse of or failure to secure personal information could also result in violation of data privacy laws and regulations, proceedings against us by governmental entities or others, damage to our reputation and credibility and could have a negative impact on revenues and profits.
RISKS RELATED TO OUR STOCK AND STOCK PRICE
Our Quarterly Revenues And Operating Results Fluctuate As A Result Of A Variety Of Factors, Including Fluctuations In Demand For Footwear, Delivery Delays And Potential Fluctuations In Our Estimated Annualized Tax Rate, Which May Result In Volatility Of Our Stock Price.
Our quarterly revenues and operating results have varied significantly in the past and can be expected to fluctuate in the future due to a number of factors, many of which are beyond our control. Our major customers have no obligation to purchase forecasted amounts and from time to time cancel orders, change delivery schedules, or change the mix of products ordered with minimal notice and without penalty. As a result, we may not be able to accurately predict our quarterly sales. Furthermore, our expenses are partially based on our expectations of future sales, and we may be unable to adjust spending in a timely manner to compensate for any unexpected revenue shifts. As a result, our expenses may be disproportionately large relative to our revenues, which could have a material adverse effect on our operating results.
Our annualized tax rate is based on projections of our domestic and international operating results for the year, which we review and revise as necessary at the end of each quarter. Any quarterly fluctuations in our annualized tax rate could have a material impact on our quarterly operating results and the results for any one quarter may not be indicative of results for the full year. Any shortfall in revenues or net earnings from levels expected by securities analysts and investors could cause a decrease in the trading price of our Class A Common Stock.
13
One Principal Stockholder Is Able To Control Substantially All Matters Requiring Approval By Our Stockholders And His Interests May Differ From The Interests Of Our Other Stockholders.
As of December 31, 2022, our Chairman of the Board and Chief Executive Officer, Robert Greenberg, beneficially owned 87.3% of our outstanding Class B Common Stock, members of Mr. Greenberg’s immediate family beneficially owned an additional 8.1% of our outstanding Class B Common Stock. The holders of Class A Common Stock and Class B Common Stock have identical rights except that holders of Class A Common Stock are entitled to one vote per share while holders of Class B Common Stock are entitled to ten votes per share on all matters submitted to a vote of our stockholders. As a result, as of December 31, 2022, Mr. Greenberg beneficially owned 53.1% of the aggregate number of votes eligible to be cast by our stockholders, and together with shares beneficially owned by other members of his immediate family, Mr. Greenberg and his immediate family beneficially owned 58.6% of the aggregate number of votes eligible to be cast by our stockholders. Therefore, Mr. Greenberg is able to exert significant control over all matters requiring approval by our stockholders. Matters that require the approval of our stockholders include the election of directors and the approval of mergers or other business combination transactions. Mr. Greenberg also has significant influence over our management and operations. As a result of such influence, certain transactions are not likely without the approval of Mr. Greenberg, including proxy contests, tender offers, open market purchase programs or other transactions that can give our stockholders the opportunity to realize a premium over the then-prevailing market prices for their shares of our Class A Common Stock. Because Mr. Greenberg’s interests may differ from the interests of the other stockholders, his ability to substantially control, actions requiring stockholder approval, may result in the Company taking action that is not in the interests of all stockholders. The differential in the voting rights may also adversely affect the value of our Class A Common Stock to the extent that investors or any potential future purchaser view the voting rights of our Class B Common Stock to have superior value.
Our Charter Documents And Delaware Law May Inhibit A Takeover, Which May Adversely Affect The Value Of Our Stock.
Provisions of Delaware law, our certificate of incorporation or our bylaws could make it more difficult for a third party to acquire us, even if closing such a transaction would be beneficial to our stockholders. Mr. Greenberg’s substantial beneficial ownership position, together with the authorization of Preferred Stock, the disparate voting rights between our Class A Common Stock and Class B Common Stock, the classification of our Board of Directors and the lack of cumulative voting in our certificate of incorporation and bylaws, may have the effect of delaying, deferring or preventing a change in control, may discourage bids for our Class A Common Stock at a premium over the market price of the Class A Common Stock and may adversely affect the market price of our Class A Common Stock.
None.
Our corporate headquarters are located at several properties in or near Los Angeles, California, which consist of an aggregate of approximately 248,000 square feet. We own and lease portions of our corporate headquarters.
Our North America distribution center occupies approximately 2.6 million square feet on its main campus in Southern California, which is leased from a joint venture, HF Logistics-SKX (the “JV”). The JV was formed with HF Logistics I, LLC (“HF”) in January 2010 for the purpose of building and operating the facility and is consolidated in our financial statements. An additional 2.4 million square feet of distribution center space is leased from third parties. The main campus leases expire at various dates through August 2036, and the leases for the remaining space expire at various dates through May 2028.
Our European distribution center occupies approximately 2.2 million square feet in Liege, Belgium under operating leases. These leases provide for original terms of 10 to 15 years, commencing between January 2016 and July 2020, subject to automatic extensions for recurring periods of five years unless we or the landlord terminates the lease in writing 12 months prior to the expiration of the original lease term or 12 months prior to the end of the then applicable five-year extension.
Our China distribution center occupies approximately 1.6 million square feet in Taicang, China.
Substantially all of our retail stores and showrooms are leased with terms expiring through January 2036. The leases provide for rent escalations tied to either increases in the lessor’s operating expenses, fluctuations in the consumer price index in the relevant geographical area, or a percentage of the store’s gross sales in excess of the base annual rent.
We lease most of our international administrative offices, showrooms and distribution facilities located in Asia, Central America, Europe, North America and South America. The property leases expire on various dates through October 2037.
|
Item 3. |
Legal Proceedings |
Michael Conte v. Robert Greenberg, et al. – On July 21, 2022, Skechers and certain past and present members of the Board of Directors were sued by a stockholder on behalf of our company in a derivative action in the Chancery Court of the State of Delaware, Case No. 2022-0633, alleging breach of fiduciary duty, waste of corporate assets, breach of duty of candor and breach of contract in connection with certain executive officers’ personal use of two company-owned aircraft. The complaint seeks actual damages in favor of Skechers sustained as the alleged result of defendants’ alleged breaches of fiduciary duties, judgment directing our company to take
14
all necessary actions to reform and improve its corporate governance practices, termination of certain executive officers for allegedly violating their employment agreements, judgment directing the sale of one of the company-owned aircraft and attorneys’, accountants’ and experts’ fees, costs and expenses. We believe that we have meritorious defenses and intend to defend this matter vigorously. Notwithstanding, given the early stages of these proceedings and the limited information available, we cannot predict the outcome of this legal proceeding or whether an adverse result in this case would have a material adverse impact on our results of operations or financial position.
In addition to the matters included in our reserve for loss contingencies, we occasionally become involved in litigation arising from the normal course of business, and we are unable to determine the extent of any liability that may arise from any such unanticipated future litigation. We have no reason to believe that there is a reasonable possibility or a probability that we may incur a material loss, or a material loss in excess of a recorded accrual, with respect to any other such loss contingencies. However, the outcome of litigation is inherently uncertain and assessments and decisions on defense and settlement can change significantly in a short period of time. Therefore, although we consider the likelihood of such an outcome to be remote with respect to those matters for which we have not reserved an amount for loss contingencies, if one or more of these legal matters were resolved against the Company in the same reporting period for amounts in excess of our expectations, our consolidated financial statements of a particular reporting period could be materially adversely affected.
|
Item 4. |
Mine Safety Disclosures |
Not applicable.
15
PART II
|
Item 5. |
Market for Registrant’s Common Equity, Related Stockholder Matters and Issuer Purchases of Equity Securities |
Our Class A Common Stock trades under the symbol “SKX” on the New York Stock Exchange.
HOLDERS
As of February 15, 2023, there were 81 holders of record of our Class A Common Stock (including holders who are nominees for an undetermined number of beneficial owners) and 39 holders of record of our Class B Common Stock. These figures do not include beneficial owners who hold shares in nominee name. The Class B Common Stock is not publicly traded, but each share is convertible upon request of the holder into one share of Class A Common Stock.
DIVIDEND INFORMATION
Since inception, we have not declared or paid any cash dividends on our common stock, and we have no present intention of paying any dividends on our common stock in the foreseeable future. Our Board of Directors periodically reviews our dividend policy to determine whether the declaration of dividends is appropriate.
COMPANY PURCHASES OF EQUITY SECURITIES
On January 31, 2022, the Company's Board of Directors authorized a share repurchase program (the “Share Repurchase Program”), pursuant to which the Company may, from time to time, purchase shares of its Class A Common Stock, par value $0.001 per share, for an aggregate repurchase price not to exceed $500 million. The Share Repurchase Program expires on January 31, 2025 and does not obligate the Company to acquire any particular amount of shares. There were no repurchases during the three months ended December 31, 2022 and the maximum dollar value of shares that may yet be purchased under the share program was $425.8 million.
EQUITY COMPENSATION PLAN INFORMATION
Our equity compensation plan information is provided as set forth in Part III, Item 12 of this annual report on Form 10-K.
PERFORMANCE GRAPH
The following graph demonstrates the total return to stockholders of our Class A Common Stock from December 31, 2017 to December 31, 2022, relative to the performance of the Russell 1000 Index, S&P Retail Select Industry Index, and the peer group index, which is consists of Nike, Inc., adidas AG, Steven Madden, Ltd., Wolverine World Wide, Inc., Crocs, Inc., and Deckers Outdoor Corporation. As of fiscal year 2022, we believe the members of the S&P Retail Select Industry Index better represents our business.
Comparison of 5 Year Cumulative Total Returns
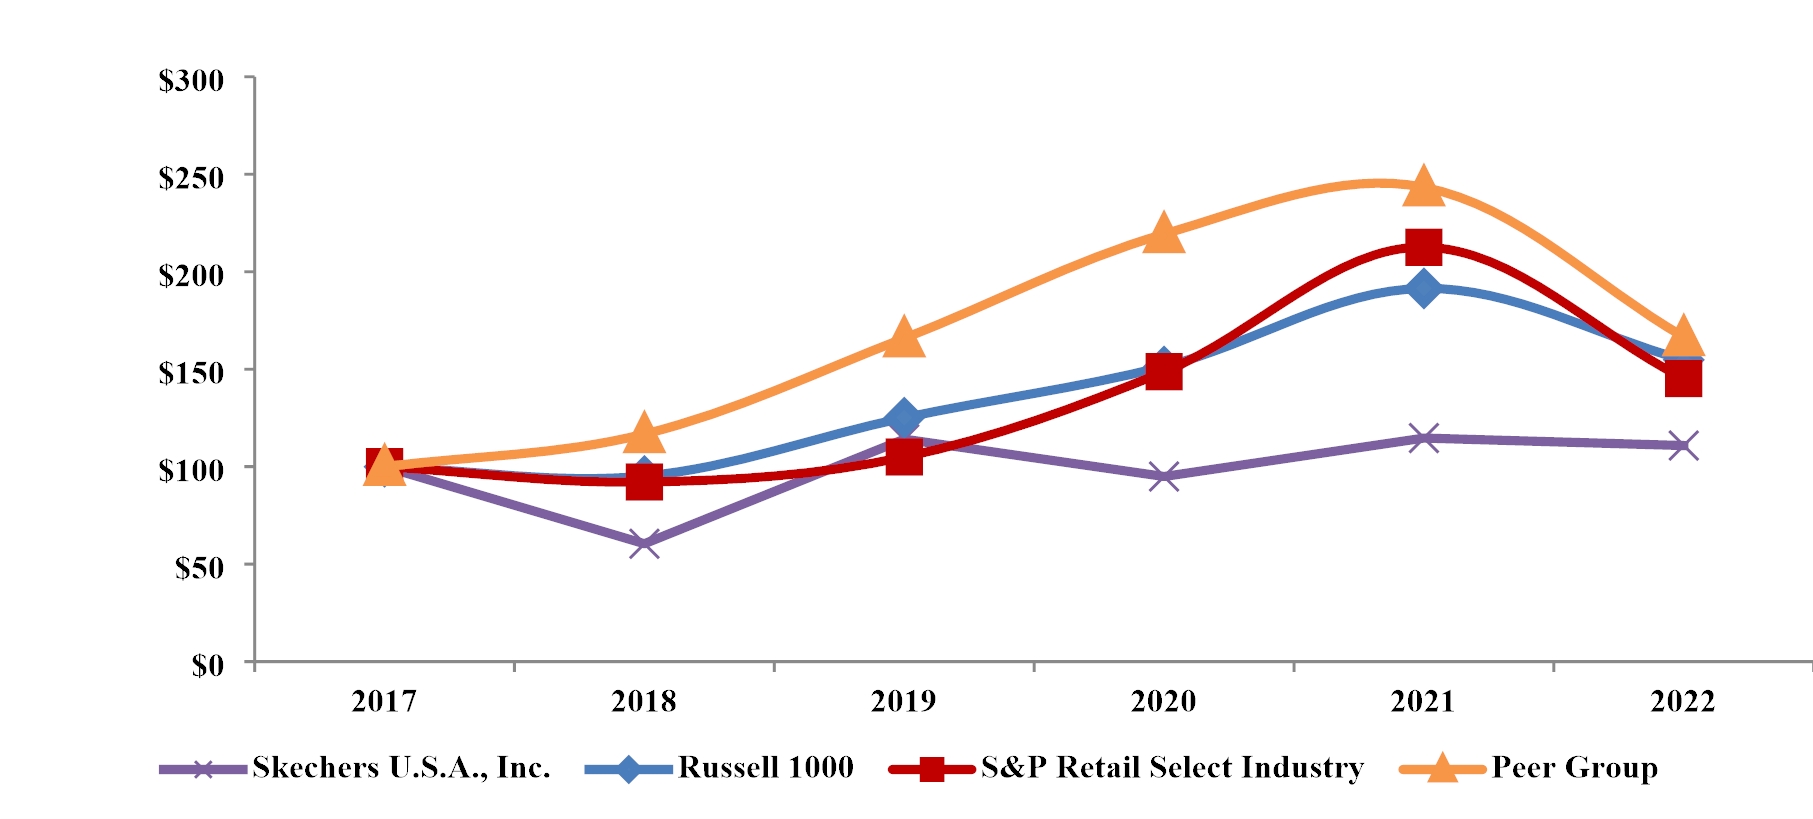
|
(in dollars) |
|
2017 |
|
|
2018 |
|
|
2019 |
|
|
2020 |
|
|
2021 |
|
|
2022 |
|
|
Skechers U.S.A., Inc. |
|
|
100.00 |
|
|
|
60.49 |
|
|
|
114.14 |
|
|
|
94.98 |
|
|
|
114.69 |
|
|
|
110.86 |
|
|
Russell 1000 |
|
|
100.00 |
|
|
|
95.22 |
|
|
|
125.14 |
|
|
|
151.37 |
|
|
|
191.42 |
|
|
|
154.80 |
|
|
S&P Retail Select Industry |
|
|
100.00 |
|
|
|
92.12 |
|
|
|
104.99 |
|
|
|
148.70 |
|
|
|
212.60 |
|
|
|
145.17 |
|
|
Peer Group |
|
|
100.00 |
|
|
|
116.76 |
|
|
|
165.94 |
|
|
|
219.31 |
|
|
|
243.31 |
|
|
|
166.51 |
|
16
|
Item 7. |
Management’s Discussion and Analysis of Financial Condition and Results of Operations |
The following discussion and analysis of our financial condition and results of operations should be read in conjunction with our consolidated financial statements and related notes included elsewhere in this annual report on Form 10-K. We intend for this discussion to provide the reader with information that will assist in understanding our consolidated financial statements, the changes in certain key items in those financial statements from period to period, and the primary factors that accounted for those changes, as well as how certain accounting principles affect our consolidated financial statements. The discussion also provides information about the financial results of the various segments of our business to provide a better understanding of how those segments and their results affect the financial condition and results of operations of our company as a whole.
During the first quarter of 2022, the Company realigned its reporting structure to two reportable segments, Wholesale and Direct-to-Consumer. Prior period amounts have been recast. Wholesale includes sales to department stores, family shoe stores, specialty running and sporting goods retailers, and big box club stores; franchisee and licensee third-party store operators; dedicated e-commerce retailers; and international distributors. Direct-to-Consumer includes direct sales to consumers through an integrated retail format of company-owned physical stores and digital platforms and hosted digital marketplaces in select international markets. With the exception of our segment realignment, this section of this Form 10-K generally discusses 2022 and 2021 items and year-to-year comparisons between 2022 and 2021. Discussions of 2020 items and year-to-year comparisons that are not included in this Form 10-K can be found in “Part II—Item 7. Management’s Discussion and Analysis of Financial Condition and Results of Operations—Results of Operations” and “—Liquidity and Capital Resources” in our annual report on Form 10-K for the fiscal year ended December 31, 2021 filed with the SEC on February 25, 2022.
OVERVIEW
This year was a significant milestone for the Company. Not only was it our 30th year in business, we also achieved record sales of $7.4 billion, an increase of $1.1 billion or 18% over the prior year. Our continued growth demonstrates the strength of our brand and the robust demand for our innovative product portfolio. The year also presented challenges, including temporary COVID-related store closures predominantly in China, rising freight and logistics costs, elevated inventory levels and supply chain disruptions that created congestion in our distribution network. We were able to manage these challenges due to the flexibility, creativity and dedication of the global Skechers organization.
Our core product philosophy of comfort, style, innovation, and quality at the right price continues to resonate with consumers, and we remain focused on delivering our comfort technology footwear as quickly as possible to meet consumer demand. We remain focused on executing against our long-term growth strategies and believe we are well positioned to meet our sales goal of $10 billion by 2026. We are committed to the following investments in support of our global growth strategy:
|
|
• |
Wholesale: product development, marketing, distribution infrastructure and sales capabilities. |
|
|
• |
Direct-to-Consumer: product development, marketing, new stores, digital commerce capabilities and distribution infrastructure. |
Growth in the Wholesale segment is expected to derive from expanding our existing shelf-space with current partners, acquiring new partners, supporting the growth of incremental franchise and licensed Skechers branded stores, as well as the introduction of new products to existing partners. Growth in the Direct-to-Consumer segment is expected to derive from increasing our digital commerce capabilities, expanding our physical retail footprint and leveraging third-party digital platforms and marketplaces.
17
RESULTS OF OPERATIONS
Selected information from our results of operations follows:
|
|
|
Year Ended December 31, |
|
|
Change |
|
|
(in thousands) |
|
2022 |
|
|
2021 |
|
|
$ |
% |
|
|
Sales |
|
$ |
7,444,550 |
|
|
$ |
6,310,187 |
|
|
|
1,134,363 |
|
|
|
18.0 |
|
|
Cost of sales |
|
|
3,929,193 |
|
|
|
3,185,816 |
|
|
|
743,377 |
|
|
|
23.3 |
|
|
Gross profit |
|
|
3,515,357 |
|
|
|
3,124,371 |
|
|
|
390,986 |
|
|
|
12.5 |
|
|
Gross margin |
|
|
47.2 |
|
% |
|
49.5 |
|
% |
|
|
|
|
|
(230 |
)bps |
|
Operating expenses |
|
|
|
|
|
|
|
|
|
|
|
|
|
|
|
|
|
Selling |
|
|
583,626 |
|
|
|
499,532 |
|
|
|
84,094 |
|
|
|
16.8 |
|
|
General and administrative |
|
|
2,385,061 |
|
|
|
2,026,652 |
|
|
|
358,409 |
|
|
|
17.7 |
|
|
Total operating expenses |
|
|
2,968,687 |
|
|
|
2,526,184 |
|
|
|
442,503 |
|
|
|
17.5 |
|
|
As a % of sales |
|
|
39.9 |
|
% |
|
40.0 |
|
% |
|
|
|
|
|
(20 |
)bps |
|
Earnings from operations |
|
|
546,670 |
|
|
|
598,187 |
|
|
|
(51,517 |
) |
|
|
(8.6 |
) |
|
Operating margin |
|
|
7.3 |
|
% |
|
9.5 |
|
% |
|
|
|
|
|
(210 |
)bps |
|
Other expense |
|
|
(24,413 |
) |
|
|
(28,430 |
) |
|
|
4,017 |
|
|
|
(14.1 |
) |
|
Earnings before income taxes |
|
|
522,257 |
|
|
|
569,757 |
|
|
|
(47,500 |
) |
|
|
(8.3 |
) |
|
Income tax expense (benefit) |
|
|
93,095 |
|
|
|
(245,875 |
) |
|
|
338,970 |
|
|
n/m |
|
|
Net earnings |
|
|
429,162 |
|
|
|
815,632 |
|
|
|
(386,470 |
) |
|
|
(47.4 |
) |
|
Less: Net earnings attributable to noncontrolling interests |
|
|
56,134 |
|
|
|
74,129 |
|
|
|
(17,995 |
) |
|
|
(24.3 |
) |
|
Net earnings attributable to Skechers U.S.A., Inc. |
|
$ |
373,028 |
|
|
$ |
741,503 |
|
|
|
(368,475 |
) |
|
|
(49.7 |
) |
Sales
Sales increased $1.1 billion, or 18.0%, to $7.4 billion as a result of a 20.0% increase domestically and a 16.6% increase internationally. Wholesale sales increased 23.2% and Direct-to-Consumer increased 10.2%. Sales increased overall due to improved volume and higher average selling prices.
Gross margin
Gross margin decreased 230 basis points to 47.2% primarily driven by increased freight and logistics costs, partially offset by average selling price increases.
Operating expenses
Operating expenses increased $442.5 million, or 17.5%, to $3.0 billion, and as a percentage of sales improved 20 basis points to 39.9%. Selling expenses increased $84.1 million, or 16.8%, to $583.6 million, primarily due to higher demand creation expenditures in digital advertising and global marketing. General and administrative expenses increased $358.4 million, or 17.7%, to $2.4 billion, due to higher labor and compensation costs of $193.9 million and warehouse and distribution expenses of $75.4 million as a result of supply chain and logistics challenges at the domestic distribution center and higher volume driven expenses. Included in these costs is approximately $90.0 million of labor and distribution expenses related to the supply chain challenges at the domestic distribution center.
Other expense
Other expense decreased $4.0 million to $24.4 million, compared to $28.4 million, primarily due to improvements in foreign currency exchange rates in Europe, Middle East & Africa.
Income taxes
Income tax expense (benefit) and the effective tax rate were as follows:
|
|
|
Year Ended December 31, |
|
|
(in thousands) |
|
2022 |
|
|
2021 |
|
|
Income tax expense (benefit) |
|
$ |
93,095 |
|
|
$ |
(245,875 |
) |
|
Effective tax rate |
|
|
17.8 |
% |
|
|
(43.2 |
)% |
Income tax expense was $93.1 million as compared to an income tax benefit of $245.9 million in 2021 due to the establishment of deferred tax assets from an intra-entity transfer of certain intellectual property rights of $346.8 million. Our effective tax rate was 17.8% as compared to negative 43.2% tax rate in the prior year, which included the impact of a 60.9% benefit from the intellectual property rights transfer.
Our income tax expense (benefit) and effective income tax rate are significantly impacted by the mix of our domestic and foreign earnings (losses) before income taxes. In the foreign jurisdictions in which we have operations, the applicable statutory rates range from 0.0% to 34.0%, which on average are generally significantly lower than the U.S. federal and state combined statutory rate of approximately 25.0%.
18
See Note 10 – Income Taxes of the Consolidated Financial Statements for additional information.
Noncontrolling interest in net earnings of consolidated subsidiaries
Noncontrolling interest represents the share of net earnings or loss that is attributable to our joint venture partners. Net earnings attributable to noncontrolling interest decreased $18.0 million to $56.1 million as compared to $74.1 million, primarily due to reduced earnings by our joint ventures, predominantly China, due to store closures resulting from COVID in China.
RESULTS OF SEGMENT OPERATIONS
Wholesale
|
|
|
Year Ended December 31, |
|
|
2022 vs 2021 Change |
|
|
2021 vs 2020 Change |
|
|
(in thousands) |
|
2022 |
|
|
2021 |
|
|
2020 |
|
|
$ |
|
|
% |
|
|
$ |
|
|
% |
|
|
Sales |
|
$ |
4,632,429 |
|
|
$ |
3,758,640 |
|
|
$ |
2,835,010 |
|
|
|
873,789 |
|
|
|
23.2 |
|
|
|
923,630 |
|
|
|
32.6 |
|
|
Gross profit |
|
|
1,669,276 |
|
|
|
1,437,517 |
|
|
|
1,112,558 |
|
|
|
231,759 |
|
|
|
16.1 |
|
|
|
324,959 |
|
|
|
29.2 |
|
|
Gross margin |
|
|
36.0 |
% |
|
|
38.2 |
% |
|
|
39.2 |
% |
|
|
|
|
|
|
(220 |
)bps |
|
|
|
|
|
|
(100 |
)bps |
2022 to 2021 Comparison
Wholesale sales increased $0.9 billion, or 23.2%, to $4.6 billion, driven primarily by growth of 28.7% in the Americas and Europe, Middle East & Africa of 33.9%. Volume increased 18.2% in the number of units sold and average selling price per unit increased 4.8%.
Wholesale gross margin decreased 220 basis points to 36.0% due to higher average cost per unit, primarily driven by increased freight and logistics costs, partially offset by average selling price increases.
2021 to 2020 Comparison
Wholesale sales increased $0.9 billion, or 32.6% to $3.8 billion, as a result of growth across the Americas of 30.1%, Europe, Middle East & Africa of 37.3% and Asia Pacific of 32.3% which were impacted by 2020 COVID-related market closures. Volume increased 27.9% in the number of units sold and average selling price per unit increased 3.6%.
Wholesale gross margin decreased 100 basis points to 38.2% primarily due to higher average cost per unit, partially offset by the increase in the average selling price per unit.
Direct-to-Consumer
|
|
|
Year Ended December 31, |
|
|
2022 vs 2021 Change |
|
|
2021 vs 2020 Change |
|
|
(in thousands) |
|
2022 |
|
|
2021 |
|
|
2020 |
|
|
$ |
|
|
% |
|
|
$ |
|
|
% |
|
|
Sales |
|
$ |
2,812,121 |
|
|
$ |
2,551,547 |
|
|
$ |
1,778,420 |
|
|
|
260,574 |
|
|
|
10.2 |
|
|
|
773,127 |
|
|
|
43.5 |
|
|
Gross profit |
|
|
1,846,081 |
|
|
|
1,686,854 |
|
|
|
1,093,240 |
|
|
|
159,227 |
|
|
|
9.4 |
|
|
|
593,614 |
|
|
|
54.3 |
|
|
Gross margin |
|
|
65.6 |
% |
|
|
66.1 |
% |
|
|
61.5 |
% |
|
|
|
|
|
|
(50 |
)bps |
|
|
|
|
|
|
460 |
bps |
2022 to 2021 Comparison
Direct-to-Consumer sales increased $260.6 million, or 10.2%, to $2.8 billion, led by increases in the Americas of 13.8%, Europe, Middle East & Africa of 25.3%, and Asia Pacific of 1.8%. Volume increased 6.6% in the number of units sold and average selling price per unit increased 3.4%.
Direct-to-Consumer gross margin decreased 50 basis points to 65.6%, due to higher average cost per unit, primarily driven by increased freight costs, partially offset by average selling price increases.
2021 to 2020 Comparison
Direct-to-Consumer sales increased $0.8 billion, or 43.5%, to $2.6 billion, driven by increases of 48.6% in the Americas, 31.6% in Asia Pacific, and 76.8% in Europe, Middle East & Africa which experienced COVID restrictions in 2020. Average selling price per unit increased 14.7% and volume increased 25.0% in the number of units sold.
Direct-to-Consumer gross margin increased 460 basis points to 66.1%, primarily driven by higher average selling prices.
LIQUIDITY AND CAPITAL RESOURCES
Liquidity outlook
We have cash and cash equivalents of $615.7 million at December 31, 2022. Amounts held outside the U.S. were $516.8 million, or 83.9%, and approximately $206.7 million was available for repatriation to the U.S. as of December 31, 2022 without incurring additional U.S. federal income taxes and applicable non-U.S. income and withholding taxes.
19
We finance our production activities in part through the use of interest-bearing open purchase arrangements with certain of our contract manufacturers. These facilities currently bear interest at a rate between 0.0% and 0.4% for 30- to 60-day financing, depending on the factory. We believe that the use of these arrangements affords us additional liquidity and flexibility. We do not have any long-term contracts with any of our manufacturers, however, we have long-standing relationships with many and believe our relationships to be positive.
At December 31, 2022, we have unused credit capacity of $747.3 million on our revolving credit facility, with an additional $250.0 million available through an accordion feature. We believe that anticipated cash flows from operations, existing cash and investments balances, available borrowings under our revolving credit facility, and current financing arrangements will be sufficient to provide us with the liquidity necessary to fund our anticipated working capital and capital requirements for the next twelve months.
Cash Flows
Our working capital at December 31, 2022 was $2.0 billion, an increase of $0.1 billion from working capital of $1.9 billion at December 31, 2021. Our cash and cash equivalents at December 31, 2022 were $615.7 million, compared to $796.3 million at December 31, 2021. Our primary source of operating cash is collections from customers. Our primary uses of cash are inventory purchases, selling, general and administrative expenses and capital expenditures.
Operating Activities
Net cash provided by operating activities was $238.3 million for 2022 and $212.2 million for 2021. The $26.2 million increase in cash flows from operating activities in 2022 resulted from lower inventory purchases, partially offset by higher accounts receivables balances on wholesale sales.
Investing Activities
Net cash used in investing activities was $287.5 million for 2022 as compared to $344.7 million for 2021. The $57.2 million decrease was due to lower investment purchases and proceeds, partially offset by increased capital expenditures.
Our capital investments remain focused on supporting our strategic growth priorities, growing our Direct-to-Consumer business, as well as expanding the presence of our brand internationally. Capital expenditures for the year ended December 31, 2022 were approximately $359.0 million, which included $132.3 million for the expansion of our global distribution infrastructure, $103.7 million for investments in our retail stores and direct-to-consumer technologies, and $88.8 million of investments in our expanded corporate offices domestically and in India. We expect our capital expenditures for 2023 to be approximately $300.0 million to $350.0 million, as we continue to invest in our strategic priorities, including additional stores, added omnichannel capabilities and incremental distribution capacity in key markets. We expect to fund ongoing capital expenses through a combination of available cash and borrowings.
Financing Activities
Net cash used in financing activities was $118.1 million during 2022 compared to $433.9 million in 2021. The decrease is primarily the result of lower payments on long-term borrowings of $392.0 million, partially offset by the repurchase of $74.2 million of common stock.
Capital Resources and Prospective Capital Requirements
Share Repurchase Program
On January 31, 2022, the Company's Board of Directors authorized a share repurchase program (the “Share Repurchase Program”), pursuant to which the Company may, from time to time, purchase shares of its Class A Common Stock, par value $0.001 per share, for an aggregate repurchase price not to exceed $500 million. The Share Repurchase Program expires on January 31, 2025 and does not obligate the Company to acquire any particular amount of shares. As of December 31, 2022, $425.8 million remains available under the Share Repurchase Program.
Financing Arrangements
As of December 31, 2022, outstanding short-term and long-term borrowings were $339.3 million, of which, $257.4 million relates to loans for our domestic and China distribution centers, $54.4 million relates to our operations in China and the remainder relates to our international operations. Our long-term debt obligations contain both financial and non-financial covenants, including cross-default provisions. We were in compliance with all debt covenants related to our short-term and long-term borrowings as of the date of this annual report. See Note 6 – Financial Commitments of the Consolidated Financial Statements for additional information.
Commitments
Our material cash requirements as of December 31, 2022 which are not reflected as liabilities in the consolidated balance sheets include open purchase commitments with our foreign manufacturers of approximately $1.1 billion.
20
We are required to provide standby letters of credit to support certain obligations that arise in the ordinary course of business and may choose to provide letters of credit in place of posting cash collateral. Although the letters of credit are off-balance sheet, the majority of the obligations to which they relate are reflected as liabilities in the consolidated balance sheets.
CRITICAL ACCOUNTING POLICIES AND USE OF ESTIMATES
The preparation of our consolidated financial statements requires us to make estimates that affect the reported amounts of assets, liabilities, sales and expenses, and related disclosure of contingent assets and liabilities. We base our estimates and judgments on historical experience and on various other assumptions that are believed to be reasonable under the circumstances. Actual results may differ from these estimates.
We believe the following critical accounting estimates are affected by significant judgments used in the preparation of our consolidated financial statements.
Reserves for returns and chargebacks. Revenue is recorded net of estimates for returns from our customers and potential disputed amounts or chargebacks. We accrue a liability for product returns at the time of sale based on our historical experience. Our chargeback reserve is based on a collectability percentage based on factors such as historical trends, current economic conditions, and nature of the chargeback receivables.
Allowance for bad debts. Accounts receivable is recorded net of estimated losses from our customers’ inability to pay. To minimize the likelihood of uncollectibility, customers’ credit-worthiness is reviewed and adjusted periodically in accordance with external credit reporting services, financial statements issued by the customer and our experience with the account. We determine the amount of the reserve by analyzing known uncollectible accounts, aged receivables, economic conditions in the customers’ countries or industries, historical losses and our customers’ credit-worthiness. Amounts later determined and specifically identified to be uncollectible are charged or written off against this reserve. Allowances for bad debts are recorded to general and administrative expenses.
The likelihood of a material loss on an uncollectible account would be mainly dependent on deterioration in the overall economic conditions in a particular country or region. Reserves are fully provided for all probable losses of this nature. For receivables that are not specifically identified as high risk, we provide a reserve based upon our historical loss rate as a percentage of sales.
Inventory reserves. Inventory is stated at the lower of cost or net realizable value. Inventory reserves are recorded for excess and slow-moving inventory. Our analysis includes a review of inventory quantities on hand at period-end in relation to year-to-date sales, existing orders from customers and projections for sales in the foreseeable future. The net realizable value is determined based on historical sales experience on a style-by-style basis. The valuation of inventory could be impacted by changes in public and consumer preferences, demand for product, changes in the buying patterns of both retailers and consumers and inventory management of customers.
Litigation reserves. Estimated amounts for claims that are probable and can be reasonably estimated are recorded as liabilities in our consolidated financial statements. The likelihood of a material change in these estimated reserves would depend on additional information or new claims as they may arise as well as the favorable or unfavorable outcome of particular litigation. Both the likelihood and amount (or range of loss) on a large portion of our remaining pending litigation is uncertain. As such, we are unable to make a reasonable estimate of the liability that could result from unfavorable outcomes in our remaining pending litigation. As additional information becomes available, we will assess the potential liability related to our pending litigation and revise our estimates. Such revisions in our estimates of potential liability could materially impact our results of operations and financial position.
Tax estimates. The establishment of deferred tax assets from intra-entity transfers of certain intellectual property rights and other transactions requires management to make significant estimates and assumptions to determine the fair value of such intellectual property rights. The valuation of deferred tax assets requires significant estimates and assumptions including, but not limited to, future revenue growth, discount rates and the expected life of the assets, which by their nature are inherently uncertain and may ultimately differ materially from our actual results. We record a valuation allowance when necessary to reduce our deferred tax assets to the amount that is more likely than not to be realized. The likelihood of a material change in our expected realization of our deferred tax assets depends on future taxable income and the effectiveness of our tax planning strategies amongst the various domestic and international tax jurisdictions in which we operate. We evaluate our projections of taxable income to determine the recoverability of our deferred tax assets and the need for a valuation allowance.
EXCHANGE RATES
We receive U.S. dollars for substantially all of our domestic and a portion of our international product sales, as well as our royalty income. Inventory purchases from offshore contract manufacturers are primarily denominated in U.S. dollars. However, purchase prices for our products may be impacted by fluctuations in the exchange rate between the U.S. dollar and the local currencies of the contract manufacturers, which may impact our cost of goods in the future. During 2022 and 2021, exchange rate fluctuations did not have a material impact on our inventory costs. We do not engage in hedging activities with respect to such exchange rate risk.
21
RECENT ACCOUNTING PRONOUNCEMENTS
Refer to Note 1 — Summary of Significant Accounting Policies in the accompanying Notes to the Consolidated Financial Statements for recently adopted and recently issued accounting standards.
|
Item 7A. |
Quantitative and Qualitative Disclosure About Market Risk |
Market risk is the potential loss arising from the adverse changes in market rates and prices, such as interest rates and foreign currency exchange rates. Changes in interest rates and changes in foreign currency exchange rates have and will have an impact on our results of operations.
Interest rate fluctuations. As of December 31, 2022, we have $122.8 million and $216.5 million of outstanding current and long-term borrowings, subject to changes in interest rates. A 200-basis point increase in interest rates would have increased interest expense by approximately $6.6 million for the year ended December 31, 2022. We do not expect changes in interest rates to have a material impact on our financial condition or results of operations or cash flows during the remainder of 2023. The interest rate charged on our unsecured revolving credit facility is based on SOFR, our North America distribution center construction loan is based on the one-month Bloomberg Short-Term Bank Yield Index (“BSBY”). Our China distribution center and China operational loans are based on a reference rate provided by the People’s Bank of China. Our loan with the Company’s joint venture with HF Logistics I, LLC (“HF”), HF Logistics-SKX, LLC (the “JV”), through a wholly-owned subsidiary of the JV (“HF-T1”), is based on the LIBOR Daily Floating Rate plus a margin of 1.75%. Changes in these interest rates will have an effect on the interest charged on outstanding balances.
We may enter into derivative financial instruments such as interest rate swaps in order to limit our interest rate risk on our long-term debt. We had one derivative instrument in place as of December 31, 2022 to hedge the cash flows on our $129.5 million variable rate debt on our North America distribution center, which was entered into by the JV. This instrument was a variable to fixed derivative with a notional amount of $129.5 million at December 31, 2022. Our receive rate was one-month LIBOR and the average pay rate was 0.795%. The rate swap agreement utilized by us effectively modifies our exposure to interest rate risk by converting our floating-rate debt to a fixed rate basis over the life of the loan, thus reducing the impact of interest-rate changes on future interest payments.
Foreign exchange rate fluctuations. We face market risk to the extent that changes in foreign currency exchange rates affect our non-U.S. dollar functional currency foreign subsidiaries’ revenues, expenses, assets and liabilities. In addition, changes in foreign exchange rates may affect the value of our inventory commitments. Also, inventory purchases of our products may be impacted by fluctuations in the exchange rates between the U.S. dollar and the local currencies of the contract manufacturers, which could have an impact on the cost of goods sold in the future. We manage these risks by primarily denominating these purchases and commitments in U.S. dollars.
Assets and liabilities outside the U.S. are located in regions where we have subsidiaries or joint ventures: the Americas, Europe, Middle East & Africa, and Asia-Pacific. Our investments in foreign subsidiaries and joint ventures with a functional currency other than the U.S. dollar are generally considered long-term. The fluctuation of foreign currencies resulted in a cumulative foreign currency translation loss of $36.6 million and loss of $21.0 million, for the years ended December 31, 2022 and 2021, that are deferred and recorded as a component of accumulated other comprehensive loss in stockholders’ equity. A 200-basis point reduction in each of these exchange rates at December 31, 2022 would have reduced the values of our net investments by approximately $87.5 million.
22
|
Item 8. |
Financial Statements and Supplementary Data |
Index to Consolidated Financial Statements
23
Report of Independent Registered Public Accounting Firm
Shareholders and Board of Directors
Skechers U.S.A., Inc.
Manhattan Beach, California
Opinion on the Consolidated Financial Statements
We have audited the accompanying consolidated balance sheets of Skechers U.S.A., Inc. (the “Company”) as of December 31, 2022 and 2021, the related consolidated statements of earnings, comprehensive income, equity, and cash flows for each of the three years in the period ended December 31, 2022, and the related notes and financial statement schedule listed in the accompanying index (collectively referred to as the “consolidated financial statements”). In our opinion, the consolidated financial statements present fairly, in all material respects, the financial position of the Company at December 31, 2022 and 2021, and the results of its operations and its cash flows for each of the three years in the period ended December 31, 2022, in conformity with accounting principles generally accepted in the United States of America.
We also have audited, in accordance with the standards of the Public Company Accounting Oversight Board (United States) (“PCAOB”), the Company's internal control over financial reporting as of December 31, 2022, based on criteria established in Internal Control – Integrated Framework (2013) issued by the Committee of Sponsoring Organizations of the Treadway Commission (“COSO”) and our report dated February 28, 2023 expressed an unqualified opinion thereon.
Basis for Opinion
These consolidated financial statements are the responsibility of the Company’s management. Our responsibility is to express an opinion on the Company’s consolidated financial statements based on our audits. We are a public accounting firm registered with the PCAOB and are required to be independent with respect to the Company in accordance with the U.S. federal securities laws and the applicable rules and regulations of the Securities and Exchange Commission and the PCAOB.
We conducted our audits in accordance with the standards of the PCAOB. Those standards require that we plan and perform the audit to obtain reasonable assurance about whether the consolidated financial statements are free of material misstatement, whether due to error or fraud.
Our audits included performing procedures to assess the risks of material misstatement of the consolidated financial statements, whether due to error or fraud, and performing procedures that respond to those risks. Such procedures included examining, on a test basis, evidence regarding the amounts and disclosures in the consolidated financial statements. Our audits also included evaluating the accounting principles used and significant estimates made by management, as well as evaluating the overall presentation of the consolidated financial statements. We believe that our audits provide a reasonable basis for our opinion.
Critical Audit Matter
The critical audit matter communicated below is a matter arising from the current period audit of the consolidated financial statements that was communicated or required to be communicated to the audit committee and that: (1) relates to accounts or disclosures that are material to the consolidated financial statements and (2) involved our especially challenging, subjective, or complex judgments. The communication of critical audit matter does not alter in any way our opinion on the consolidated financial statements, taken as a whole, and we are not, by communicating the critical audit matter below, providing separate opinions on the critical audit matter or on the accounts or disclosures to which it relates.
Accounting for Income Taxes
As described in Note 10 to the Company’s consolidated financial statements, the Company’s income tax expense for the fiscal year ended December 31, 2022 was $93.1 million, of which $7.3 million represented U.S. Federal tax expense, $8.3 million represented U.S. State tax expense, and the remaining $77.5 million represented foreign tax expense. The Company operates in multiple jurisdictions worldwide through its wholly-owned subsidiaries and several joint ventures.
We identified accounting for the Company’s income tax provision as a critical audit matter. The Company’s income tax provision processes include the following: (i) reporting and data accumulation from multiple foreign jurisdictions, (ii) assessment of deferred tax assets and liabilities, and (iii) development of certain complex assumptions used in transfer pricing studies and related determinations. Auditing these certain elements of the income tax provision involved especially challenging auditor judgment due to the nature and extent of audit effort required to address these matters, including the extent of specialized skill or knowledge needed.
The primary procedures we performed to address this critical audit matter included:
|
|
• |
Evaluating management’s computation of deferred tax assets and liabilities. |
24
|
|
• |
Testing mathematical accuracy and computation of the tax provision and agreeing to relevant source information. |
|
|
• |
Utilizing personnel with specialized skill and knowledge in transfer pricing to assist in evaluating the reasonableness of certain assumptions, and overall conclusions related to the Company’s transfer pricing studies over inter-company transactions. |
|
|
• |
Utilizing personnel with specialized skill and knowledge in domestic and foreign taxes to assist in assessing the appropriateness and accuracy of the income tax provision. |
/s/ BDO USA, LLP
We have served as the Company's auditor since 2013.
Los Angeles, California
February 28, 2023
25
SKECHERS U.S.A., INC. AND SUBSIDIARIES
Consolidated Balance Sheets
|
|
|
As of December 31, |
|
|
(in thousands, except par values) |
|
2022 |
|
|
2021 |
|
|
ASSETS |
|
|
Current assets |
|
|
|
|
|
|
|
|
|
Cash and cash equivalents |
|
$ |
615,733 |
|
|
$ |
796,283 |
|
|
Short-term investments |
|
|
102,166 |
|
|
|
98,580 |
|
|
Trade accounts receivable, less allowances of $59,472 and $62,684 |
|
|
848,287 |
|
|
|
732,793 |
|
|
Other receivables |
|
|
86,036 |
|
|
|
80,043 |
|
|
Inventory |
|
|
1,818,016 |
|
|
|
1,470,994 |
|
|
Prepaid expenses and other |
|
|
176,035 |
|
|
|
193,547 |
|
|
Total current assets ($1,014,962 and $1,040,765 related to VIEs) |
|
|
3,646,273 |
|
|
|
3,372,240 |
|
|
Property, plant and equipment, net |
|
|
1,345,370 |
|
|
|
1,128,909 |
|
|
Operating lease right-of-use assets |
|
|
1,200,565 |
|
|
|
1,224,580 |
|
|
Deferred tax assets |
|
|
454,190 |
|
|
|
451,355 |
|
|
Long-term investments |
|
|
70,498 |
|
|
|
145,590 |
|
|
Goodwill |
|
|
93,497 |
|
|
|
93,497 |
|
|
Other assets, net |
|
|
83,094 |
|
|
|
75,109 |
|
|
Total non-current assets ($598,973 and $608,607 related to VIEs) |
|
|
3,247,214 |
|
|
|
3,119,040 |
|
|
TOTAL ASSETS |
|
$ |
6,893,487 |
|
|
$ |
6,491,280 |
|
|
LIABILITIES AND EQUITY |
|
|
Current liabilities |
|
|
|
|
|
|
|
|
|
Accounts payable |
|
$ |
957,384 |
|
|
$ |
876,342 |
|
|
Accrued expenses |
|
|
294,143 |
|
|
|
265,420 |
|
|
Operating lease liabilities |
|
|
238,694 |
|
|
|
225,658 |
|
|
Current installments of long-term borrowings |
|
|
103,184 |
|
|
|
76,967 |
|
|
Short-term borrowings |
|
|
19,635 |
|
|
|
1,195 |
|
|
Total current liabilities ($568,158 and $601,929 related to VIEs) |
|
|
1,613,040 |
|
|
|
1,445,582 |
|
|
Long-term operating lease liabilities |
|
|
1,063,672 |
|
|
|
1,094,748 |
|
|
Long-term borrowings |
|
|
216,488 |
|
|
|
263,445 |
|
|
Deferred tax liabilities |
|
|
8,656 |
|
|
|
11,820 |
|
|
Other long-term liabilities |
|
|
120,045 |
|
|
|
133,613 |
|
|
Total non-current liabilities ($293,726 and $368,994 related to VIEs) |
|
|
1,408,861 |
|
|
|
1,503,626 |
|
|
Total liabilities |
|
|
3,021,901 |
|
|
|
2,949,208 |
|
|
Commitments and contingencies (Note 7) |
|
|
|
|
|
|
|
|
|
Stockholders’ equity |
|
|
|
|
|
|
|
|
|
Preferred Stock, $0.001 par value; 10,000 shares authorized; none issued and outstanding |
|
|
— |
|
|
|
— |
|
|
Class A Common Stock, $0.001 par value; 500,000 shares authorized;
134,473 and 135,107 shares issued and outstanding |
|
|
134 |
|
|
|
135 |
|
|
Class B Common Stock, $0.001 par value; 75,000 shares authorized;
20,810 and 20,939 shares issued and outstanding |
|
|
21 |
|
|
|
21 |
|
|
Additional paid-in capital |
|
|
403,799 |
|
|
|
429,608 |
|
|
Accumulated other comprehensive loss |
|
|
(84,897 |
) |
|
|
(48,323 |
) |
|
Retained earnings |
|
|
3,250,931 |
|
|
|
2,877,903 |
|
|
Skechers U.S.A., Inc. equity |
|
|
3,569,988 |
|
|
|
3,259,344 |
|
|
Noncontrolling interests |
|
|
301,598 |
|
|
|
282,728 |
|
|
Total stockholders' equity |
|
|
3,871,586 |
|
|
|
3,542,072 |
|
|
TOTAL LIABILITIES AND EQUITY |
|
$ |
6,893,487 |
|
|
$ |
6,491,280 |
|
See accompanying notes to consolidated financial statements.
26
SKECHERS U.S.A., INC. AND SUBSIDIARIES
Consolidated Statements of Earnings
|
|
Year Ended December 31, |
|
|
(in thousands, except per share data) |
2022 |
|
|
2021 |
|
|
2020 |
|
|
Sales |
$ |
7,444,550 |
|
|
$ |
6,310,187 |
|
|
$ |
4,613,430 |
|
|
Cost of sales |
|
3,929,193 |
|
|
|
3,185,816 |
|
|
|
2,407,632 |
|
|
Gross profit |
|
3,515,357 |
|
|
|
3,124,371 |
|
|
|
2,205,798 |
|
|
Operating expenses |
|
|
|
|
|
|
|
|
|
|
|
|
Selling |
|
583,626 |
|
|
|
499,532 |
|
|
|
351,471 |
|
|
General and administrative |
|
2,385,061 |
|
|
|
2,026,652 |
|
|
|
1,720,643 |
|
|
Total operating expenses |
|
2,968,687 |
|
|
|
2,526,184 |
|
|
|
2,072,114 |
|
|
Earnings from operations |
|
546,670 |
|
|
|
598,187 |
|
|
|
133,684 |
|
|
Total other income (expense) |
|
(24,413 |
) |
|
|
(28,430 |
) |
|
|
21,045 |
|
|
Earnings before income taxes |
|
522,257 |
|
|
|
569,757 |
|
|
|
154,729 |
|
|
Income tax expense (benefit) |
|
93,095 |
|
|
|
(245,875 |
) |
|
|
8,502 |
|
|
Net earnings |
|
429,162 |
|
|
|
815,632 |
|
|
|
146,227 |
|
|
Less: Net earnings attributable to noncontrolling interest |
|
56,134 |
|
|
|
74,129 |
|
|
|
47,663 |
|
|
Net earnings attributable to Skechers U.S.A., Inc. |
$ |
373,028 |
|
|
$ |
741,503 |
|
|
$ |
98,564 |
|
|
Net earnings per share attributable to Skechers U.S.A., Inc. |
|
|
|
|
|
|
|
|
|
|
|
|
Basic |
$ |
2.40 |
|
|
$ |
4.77 |
|
|
$ |
0.64 |
|
|
Diluted |
$ |
2.38 |
|
|
$ |
4.73 |
|
|
$ |
0.64 |
|
|
Weighted-average shares used in calculating net earnings per share attributable to Skechers U.S.A., Inc. |
|
|
|
|
|
|
|
|
|
|
|
|
Basic |
|
155,627 |
|
|
|
155,539 |
|
|
|
154,184 |
|
|
Diluted |
|
156,608 |
|
|
|
156,794 |
|
|
|
154,894 |
|
See accompanying notes to consolidated financial statements.
27
SKECHERS U.S.A., INC. AND SUBSIDIARIES
Consolidated Statements of Comprehensive Income
|
|
|
Year Ended December 31, |
|
|
(in thousands) |
|
2022 |
|
|
2021 |
|
|
2020 |
|
|
Net earnings |
|
$ |
429,162 |
|
|
$ |
815,632 |
|
|
$ |
146,227 |
|
|
Other comprehensive income, net of tax |
|
|
|
|
|
|
|
|
|
|
|
|
|
Net unrealized gain (loss) on derivative contract |
|
|
9,787 |
|
|
|
3,372 |
|
|
|
(1,649 |
) |
|
Gain (loss) on foreign currency translation adjustment |
|
|
(53,552 |
) |
|
|
(22,141 |
) |
|
|
11,540 |
|
|
Comprehensive income |
|
|
385,397 |
|
|
|
796,863 |
|
|
|
156,118 |
|
|
Less: Comprehensive income attributable to noncontrolling interests |
|
|
48,190 |
|
|
|
76,398 |
|
|
|
54,846 |
|
|
Comprehensive income attributable to Skechers U.S.A., Inc. |
|
$ |
337,207 |
|
|
$ |
720,465 |
|
|
$ |
101,272 |
|
See accompanying notes to consolidated financial statements.
28
SKECHERS U.S.A., INC. AND SUBSIDIARIES
Consolidated Statements of Equity
|
|
|
Shares |
|
|
Amount |
|
|
|
|
|
|
Accumulated |
|
|
|
|
|
|
|
|
|
|
|
|
|
|
|
|
|
|
|
|
Class A |
|
|
Class B |
|
|
Class A |
|
|
Class B |
|
|
Additional |
|
|
other |
|
|
|
|
|
|
Skechers |
|
|
|
|
|
|
Total |
|
|
|
|
Common |
|
|
Common |
|
|
Common |
|
|
Common |
|
|
paid-in |
|
|
comprehensive |
|
|
Retained |
|
|
U.S.A., Inc. |
|
|
Noncontrolling |
|
|
stockholders' |
|
|
(in thousands) |
|
Stock |
|
|
Stock |
|
|
Stock |
|
|
Stock |
|
|
capital |
|
|
loss |
|
|
earnings |
|
|
equity |
|
|
interests |
|
|
equity |
|
|
Balance at December 31, 2019 |
|
|
131,071 |
|
|
|
22,408 |
|
|
$ |
131 |
|
|
$ |
22 |
|
|
$ |
306,669 |
|
|
$ |
(29,993 |
) |
|
$ |
2,037,836 |
|
|
$ |
2,314,665 |
|
|
$ |
221,442 |
|
|
$ |
2,536,107 |
|
|
Net earnings |
|
|
— |
|
|
|
— |
|
|
|
— |
|
|
|
— |
|
|
|
— |
|
|
|
— |
|
|
|
98,564 |
|
|
|
98,564 |
|
|
|
47,663 |
|
|
|
146,227 |
|
|
Foreign currency translation adjustment |
|
|
— |
|
|
|
— |
|
|
|
— |
|
|
|
— |
|
|
|
— |
|
|
|
2,708 |
|
|
|
— |
|
|
|
2,708 |
|
|
|
8,832 |
|
|
|
11,540 |
|
|
Distributions to noncontrolling interests |
|
|
— |
|
|
|
— |
|
|
|
— |
|
|
|
— |
|
|
|
— |
|
|
|
— |
|
|
|
— |
|
|
|
— |
|
|
|
(81,105 |
) |
|
|
(81,105 |
) |
|
Noncontrolling interest of acquired businesses |
|
|
— |
|
|
|
— |
|
|
|
— |
|
|
|
— |
|
|
|
— |
|
|
|
— |
|
|
|
— |
|
|
|
— |
|
|
|
49,045 |
|
|
|
49,045 |
|
|
Net unrealized loss on derivative contract |
|
|
— |
|
|
|
— |
|
|
|
— |
|
|
|
— |
|
|
|
— |
|
|
|
— |
|
|
|
— |
|
|
|
— |
|
|
|
(1,649 |
) |
|
|
(1,649 |
) |
|
Stock compensation expense |
|
|
— |
|
|
|
— |
|
|
|
— |
|
|
|
— |
|
|
|
65,240 |
|
|
|
— |
|
|
|
— |
|
|
|
65,240 |
|
|
|
— |
|
|
|
65,240 |
|
|
Proceeds from the employee stock purchase plan |
|
|
233 |
|
|
|
— |
|
|
|
1 |
|
|
|
— |
|
|
|
5,915 |
|
|
|
— |
|
|
|
— |
|
|
|
5,916 |
|
|
|
— |
|
|
|
5,916 |
|
|
Shares issued under the incentive award plan |
|
|
1,094 |
|
|
|
— |
|
|
|
1 |
|
|
|
— |
|
|
|
(1 |
) |
|
|
— |
|
|
|
— |
|
|
|
— |
|
|
|
— |
|
|
|
— |
|
|
Shares redeemed for employee tax withholdings |
|
|
(172 |
) |
|
|
— |
|
|
|
— |
|
|
|
— |
|
|
|
(5,658 |
) |
|
|
— |
|
|
|
— |
|
|
|
(5,658 |
) |
|
|
— |
|
|
|
(5,658 |
) |
|
Conversion of Class B Common Stock into Class A Common Stock |
|
|
1,392 |
|
|
|
(1,392 |
) |
|
|
1 |
|
|
|
(1 |
) |
|
|
— |
|
|
|
— |
|
|
|
— |
|
|
|
— |
|
|
|
— |
|
|
|
— |
|
|
Balance at December 31, 2020 |
|
|
133,618 |
|
|
|
21,016 |
|
|
$ |
134 |
|
|
$ |
21 |
|
|
$ |
372,165 |
|
|
$ |
(27,285 |
) |
|
$ |
2,136,400 |
|
|
$ |
2,481,435 |
|
|
$ |
244,228 |
|
|
$ |
2,725,663 |
|
|
Net earnings |
|
|
— |
|
|
|
— |
|
|
|
— |
|
|
|
— |
|
|
|
— |
|
|
|
— |
|
|
|
741,503 |
|
|
|
741,503 |
|
|
|
74,129 |
|
|
|
815,632 |
|
|
Foreign currency translation adjustment |
|
|
— |
|
|
|
— |
|
|
|
— |
|
|
|
— |
|
|
|
— |
|
|
|
(21,038 |
) |
|
|
— |
|
|
|
(21,038 |
) |
|
|
(1,103 |
) |
|
|
(22,141 |
) |
|
Contributions from noncontrolling interests |
|
|
— |
|
|
|
— |
|
|
|
— |
|
|
|
— |
|
|
|
— |
|
|
|
— |
|
|
|
— |
|
|
|
— |
|
|
|
6,731 |
|
|
|
6,731 |
|
|
Distributions to noncontrolling interests |
|
|
— |
|
|
|
— |
|
|
|
— |
|
|
|
— |
|
|
|
— |
|
|
|
— |
|
|
|
— |
|
|
|
— |
|
|
|
(41,557 |
) |
|
|
(41,557 |
) |
|
Purchase of noncontrolling interest |
|
|
— |
|
|
|
— |
|
|
|
— |
|
|
|
— |
|
|
|
(6,856 |
) |
|
|
— |
|
|
|
— |
|
|
|
(6,856 |
) |
|
|
(3,072 |
) |
|
|
(9,928 |
) |
|
Net unrealized gain on derivative contract |
|
|
— |
|
|
|
— |
|
|
|
— |
|
|
|
— |
|
|
|
— |
|
|
|
— |
|
|
|
— |
|
|
|
— |
|
|
|
3,372 |
|
|
|
3,372 |
|
|
Stock compensation expense |
|
|
— |
|
|
|
— |
|
|
|
— |
|
|
|
— |
|
|
|
60,108 |
|
|
|
— |
|
|
|
— |
|
|
|
60,108 |
|
|
|
— |
|
|
|
60,108 |
|
|
Proceeds from the employee stock purchase plan |
|
|
226 |
|
|
|
— |
|
|
|
— |
|
|
|
— |
|
|
|
7,276 |
|
|
|
— |
|
|
|
— |
|
|
|
7,276 |
|
|
|
— |
|
|
|
7,276 |
|
|
Shares issued under the incentive award plan |
|
|
1,252 |
|
|
|
— |
|
|
|
1 |
|
|
|
— |
|
|
|
(1 |
) |
|
|
— |
|
|
|
— |
|
|
|
— |
|
|
|
— |
|
|
|
— |
|
|
Shares redeemed for employee tax withholdings |
|
|
(66 |
) |
|
|
— |
|
|
|
— |
|
|
|
— |
|
|
|
(3,084 |
) |
|
|
— |
|
|
|
— |
|
|
|
(3,084 |
) |
|
|
— |
|
|
|
(3,084 |
) |
|
Conversion of Class B Common Stock into Class A Common Stock |
|
|
77 |
|
|
|
(77 |
) |
|
|
— |
|
|
|
— |
|
|
|
— |
|
|
|
— |
|
|
|
— |
|
|
|
— |
|
|
|
— |
|
|
|
— |
|
|
Balance at December 31, 2021 |
|
|
135,107 |
|
|
|
20,939 |
|
|
$ |
135 |
|
|
$ |
21 |
|
|
$ |
429,608 |
|
|
$ |
(48,323 |
) |
|
$ |
2,877,903 |
|
|
$ |
3,259,344 |
|
|
$ |
282,728 |
|
|
$ |
3,542,072 |
|
|
Net earnings |
|
|
— |
|
|
|
— |
|
|
|
— |
|
|
|
— |
|
|
|
— |
|
|
|
— |
|
|
|
373,028 |
|
|
|
373,028 |
|
|
|
56,134 |
|
|
|
429,162 |
|
|
Foreign currency translation adjustment |
|
|
— |
|
|
|
— |
|
|
|
— |
|
|
|
— |
|
|
|
— |
|
|
|
(36,574 |
) |
|
|
— |
|
|
|
(36,574 |
) |
|
|
(16,978 |
) |
|
|
(53,552 |
) |
|
Distributions to noncontrolling interests |
|
|
— |
|
|
|
— |
|
|
|
— |
|
|
|
— |
|
|
|
— |
|
|
|
— |
|
|
|
— |
|
|
|
— |
|
|
|
(29,320 |
) |
|
|
(29,320 |
) |
|
Net unrealized gain on derivative contract |
|
|
— |
|
|
|
— |
|
|
|
— |
|
|
|
— |
|
|
|
753 |
|
|
|
— |
|
|
|
— |
|
|
|
753 |
|
|
|
9,034 |
|
|
|
9,787 |
|
|
Stock compensation expense |
|
|
— |
|
|
|
— |
|
|
|
— |
|
|
|
— |
|
|
|
59,874 |
|
|
|
— |
|
|
|
— |
|
|
|
59,874 |
|
|
|
— |
|
|
|
59,874 |
|
|
Proceeds from the employee stock purchase plan |
|
|
243 |
|
|
|
— |
|
|
|
— |
|
|
|
— |
|
|
|
8,131 |
|
|
|
— |
|
|
|
— |
|
|
|
8,131 |
|
|
|
— |
|
|
|
8,131 |
|
|
Shares issued under the incentive award plan |
|
|
1,424 |
|
|
|
— |
|
|
|
2 |
|
|
|
— |
|
|
|
(1 |
) |
|
|
— |
|
|
|
— |
|
|
|
1 |
|
|
|
— |
|
|
|
1 |
|
|
Shares redeemed for employee tax withholdings |
|
|
(503 |
) |
|
|
— |
|
|
|
(1 |
) |
|
|
— |
|
|
|
(20,323 |
) |
|
|
— |
|
|
|
— |
|
|
|
(20,324 |
) |
|
|
— |
|
|
|
(20,324 |
) |
|
Repurchases of common stock |
|
|
(1,927 |
) |
|
|
— |
|
|
|
(2 |
) |
|
|
— |
|
|
|
(74,243 |
) |
|
|
— |
|
|
|
— |
|
|
|
(74,245 |
) |
|
|
— |
|
|
|
(74,245 |
) |
|
Conversion of Class B Common Stock into Class A Common Stock |
|
|
129 |
|
|
|
(129 |
) |
|
|
— |
|
|
|
— |
|
|
|
— |
|
|
|
— |
|
|
|
— |
|
|
|
— |
|
|
|
— |
|
|
|
— |
|
|
Balance at December 31, 2022 |
|
|
134,473 |
|
|
|
20,810 |
|
|
$ |
134 |
|
|
$ |
21 |
|
|
$ |
403,799 |
|
|
$ |
(84,897 |
) |
|
$ |
3,250,931 |
|
|
$ |
3,569,988 |
|
|
$ |
301,598 |
|
|
$ |
3,871,586 |
|
See accompanying notes to consolidated financial statements.
29
SKECHERS U.S.A., INC. AND SUBSIDIARIES
Consolidated Statements of Cash Flows
|
|
|
Year Ended December 31, |
|
|
(in thousands) |
|
2022 |
|
|
2021 |
|
|
2020 |
|
|
Cash flows from operating activities |
|
|
|
|
|
|
|
|
|
|
|
|
|
Net earnings |
|
$ |
429,162 |
|
|
$ |
815,632 |
|
|
$ |
146,227 |
|
|
Adjustments to reconcile net earnings to net cash provided by operating activities |
|
|
|
|
|
|
|
|
|
|
|
|
|
Depreciation and amortization |
|
|
153,716 |
|
|
|
139,577 |
|
|
|
142,810 |
|
|
Provision for bad debts and returns |
|
|
37,806 |
|
|
|
62,771 |
|
|
|
50,696 |
|
|
Stock compensation |
|
|
59,874 |
|
|
|
60,108 |
|
|
|
65,240 |
|
|
Deferred income taxes |
|
|
(6,489 |
) |
|
|
(387,250 |
) |
|
|
(19,568 |
) |
|
Net settlement gain |
|
|
— |
|
|
|
— |
|
|
|
(13,877 |
) |
|
Net foreign currency adjustments |
|
|
(2,366 |
) |
|
|
2,154 |
|
|
|
(13,854 |
) |
|
Changes in operating assets and liabilities |
|
|
|
|
|
|
|
|
|
|
|
|
|
Receivables |
|
|
(179,734 |
) |
|
|
(154,248 |
) |
|
|
13,259 |
|
|
Inventory |
|
|
(389,026 |
) |
|
|
(458,002 |
) |
|
|
78,632 |
|
|
Other assets |
|
|
(33,007 |
) |
|
|
(110,464 |
) |
|
|
(153,092 |
) |
|
Accounts payable |
|
|
107,199 |
|
|
|
135,140 |
|
|
|
(37,714 |
) |
|
Other liabilities |
|
|
61,190 |
|
|
|
106,734 |
|
|
|
72,694 |
|
|
Net cash provided by operating activities |
|
|
238,325 |
|
|
|
212,152 |
|
|
|
331,453 |
|
|
Cash flows from investing activities |
|
|
|
|
|
|
|
|
|
|
|
|
|
Capital expenditures |
|
|
(358,992 |
) |
|
|
(309,674 |
) |
|
|
(309,916 |
) |
|
Purchases of investments |
|
|
(70,837 |
) |
|
|
(215,164 |
) |
|
|
(166,614 |
) |
|
Proceeds from sales and maturities of investments |
|
|
142,343 |
|
|
|
180,172 |
|
|
|
164,062 |
|
|
Net cash used in investing activities |
|
|
(287,486 |
) |
|
|
(344,666 |
) |
|
|
(312,468 |
) |
|
Cash flows from financing activities |
|
|
|
|
|
|
|
|
|
|
|
|
|
Net proceeds from the employee stock purchase plan |
|
|
8,131 |
|
|
|
7,276 |
|
|
|
5,916 |
|
|
Repayments on long-term borrowings |
|
|
(95,410 |
) |
|
|
(487,441 |
) |
|
|
(86,357 |
) |
|
Proceeds from long-term borrowings |
|
|
74,670 |
|
|
|
96,187 |
|
|
|
702,998 |
|
|
Net proceeds from (repayments on) short-term borrowings |
|
|
18,439 |
|
|
|
(2,102 |
) |
|
|
(2,492 |
) |
|
Payments for employee taxes related to stock compensation |
|
|
(20,324 |
) |
|
|
(3,084 |
) |
|
|
(5,658 |
) |
|
Repurchases of common stock |
|
|
(74,245 |
) |
|
|
— |
|
|
|
— |
|
|
Purchase of noncontrolling interest |
|
|
— |
|
|
|
(9,928 |
) |
|
|
— |
|
|
Contributions from noncontrolling interests |
|
|
— |
|
|
|
6,731 |
|
|
|
— |
|
|
Distributions to noncontrolling interests |
|
|
(29,320 |
) |
|
|
(41,557 |
) |
|
|
(81,105 |
) |
|
Net cash provided by (used in) financing activities |
|
|
(118,059 |
) |
|
|
(433,918 |
) |
|
|
533,302 |
|
|
Effect of exchange rates on cash and cash equivalents |
|
|
(13,330 |
) |
|
|
(8,111 |
) |
|
|
(6,337 |
) |
|
Net change in cash and cash equivalents |
|
|
(180,550 |
) |
|
|
(574,543 |
) |
|
|
545,950 |
|
|
Cash and cash equivalents at beginning of the period |
|
|
796,283 |
|
|
|
1,370,826 |
|
|
|
824,876 |
|
|
Cash and cash equivalents at end of the period |
|
$ |
615,733 |
|
|
$ |
796,283 |
|
|
$ |
1,370,826 |
|
|
Supplemental disclosures of cash flow information |
|
|
|
|
|
|
|
|
|
|
|
|
|
Cash paid during the period for: |
|
|
|
|
|
|
|
|
|
|
|
|
|
Interest |
|
$ |
19,293 |
|
|
$ |
14,579 |
|
|
$ |
15,987 |
|
|
Income taxes, net |
|
|
113,933 |
|
|
|
125,082 |
|
|
|
55,825 |
|
|
Non-cash transactions: |
|
|
|
|
|
|
|
|
|
|
|
|
|
Purchase price adjustment for Skechers Mexico |
|
|
— |
|
|
|
— |
|
|
|
49,045 |
|
|
ROU assets exchanged for lease liabilities |
|
|
327,022 |
|
|
|
356,855 |
|
|
|
318,713 |
|
See accompanying notes to consolidated financial statements.
30
SKECHERS U.S.A., INC. AND SUBSIDIARIES
Notes to Consolidated Financial Statements
|
(1) |
Summary of Significant Accounting Policies |
BASIS OF PRESENTATION
Skechers U.S.A., Inc. and subsidiaries (the “Company”) designs, develops, markets and distributes footwear. The Company’s consolidated financial statements have been prepared in accordance with accounting principles generally accepted in the United States (“GAAP”) as codified in the Financial Accounting Standards Board’s (“FASB”) Accounting Standards Codification (“ASC”). All significant intercompany balances and transactions have been eliminated in consolidation. Certain reclassifications have been made to the consolidated financial statements in prior years to conform to the current year presentation, including but not limited to combining royalty income into sales.
USE OF ESTIMATES
The Company has made a number of estimates and assumptions relating to the reporting of assets, liabilities, revenues and expenses and the disclosure of contingent assets and liabilities to prepare these consolidated financial statements in conformity with GAAP. Significant areas requiring the use of estimates relate primarily to allowances for bad debts, returns and customer chargebacks, inventory reserves, litigation reserves and valuation of deferred income taxes. Actual results could differ materially from those estimates.
REVENUE RECOGNITION
The Company derives income from the sale of footwear and apparel and royalties earned from licensing the Skechers brand. The Company recognizes sales revenue, net of estimated returns and excluding sales and value added taxes. Revenue is recognized at point of sale or upon shipment, the point in time where control transfers to the customer.
Wholesale sales are recognized upon shipment. Direct-to-consumer revenues are recognized at the point of sale for transactions with customers at the Company’s retail stores and recognized upon shipment for sales made through its websites.
Sales are reduced by an estimate of customer merchandise returns, which is calculated based on historical experience. The Company reserves for potential disputed amounts or chargebacks from its customers. The Company’s chargeback reserve is based on a collectability percentage calculated using factors such as historical trends, current economic conditions and nature of the chargeback.
The Company earns royalty income from symbolic licensing arrangements in which third parties sell product with the Company’s brand. Upon signing a new licensing agreement, the Company receives up-front fees, which are generally characterized as prepaid royalties. These fees are initially deferred and recognized based on sales of licensed product when the Company expects royalties to exceed the minimum guarantee. For those arrangements in which the Company does not expect royalties to exceed the minimum guarantee, an estimate of the royalties expected to be recouped is recognized on a straight-line basis over the license term.
ALLOWANCE FOR BAD DEBTS
The Company provides a reserve for estimated losses that may result from its customers’ inability to pay. The Company determines the amount of the reserve by analyzing known uncollectible accounts, aged receivables, historical losses and its customers’ credit-worthiness. Allowances for bad debts are recorded to general and administrative expenses.
WAREHOUSE AND DISTRIBUTION COSTS
The Company’s distribution network-related costs are included in general and administrative expenses. Distribution expenses, including the functions of purchasing, receiving, inspecting, allocating, surface transportation, warehousing and packaging product totaled $538.7 million, $376.5 million and $315.8 million for 2022, 2021 and 2020.
PRODUCT DESIGN AND DEVELOPMENT COSTS
The Company charges product design and development costs to general and administrative expenses. Aggregate product design and development costs were approximately $28.1 million, $24.6 million, and $17.9 million during the years ended December 31, 2022, 2021 and 2020.
ADVERTISING
Advertising costs are expensed in the period in which an advertisement first runs, or over the life of an endorsement contract. Advertising expense for the years ended December 31, 2022, 2021 and 2020 was approximately $473.7 million, $375.0 million and $248.7 million. Prepaid advertising costs were $17.2 million and $9.7 million at December 31, 2022 and 2021. Prepaid amounts represent the unamortized portion of endorsement contracts, advertising in trade publications and media productions created, but not run.
31
INCOME TAXES
The Company recognizes deferred tax liabilities for taxable temporary differences and deferred tax assets for deductible temporary differences and operating loss carry‑forwards using enacted tax rates in effect in the years the differences are expected to reverse. Deferred income tax benefit or expense is recognized as a result of changes in net deferred tax assets or deferred tax liabilities. A valuation allowance is recorded when it is more likely than not that some or all of any deferred tax assets will not be realized.
CASH AND CASH EQUIVALENTS
Cash and cash equivalents include short-term investments, which are highly liquid investments with maturities of three months or less when purchased.
INVENTORY
Inventory is stated at the lower of cost (based on the first-in, first-out method) or net realizable value. Cost of product includes shipping and handling fees. The Company estimates losses from obsolete or slow-moving inventory and reserves the cost of inventory at the time such determinations are made. Expense associated with inventory reserves is recognized in cost of sales.
PROPERTY, PLANT, AND EQUIPMENT
Property, plant and equipment are stated at cost, net of accumulated depreciation. Depreciation is provided using the straight-line method over the estimated useful lives of the assets. The Company reviews stores for impairment annually or when facts and circumstances indicate that the carrying values may be impaired. The Company did not record material impairment charges during the years ended December 31, 2022, 2021 or 2020. The principal estimated useful lives are as follows:
|
Buildings |
|
20 to 40 years |
|
Building improvements |
|
10 to 20 years |
|
Furniture, fixtures and equipment |
|
5 to 20 years |
|
Leasehold improvements |
|
Shorter of useful life or remaining lease term |
GOODWILL
Business acquisitions are accounted for under the acquisition method by assigning the purchase price to tangible and intangible assets acquired and liabilities assumed. Assets acquired and liabilities assumed are recorded at their fair values and the excess of the purchase price over the amounts assigned is recorded as goodwill. As of December 31, 2022, and December 31, 2021, the Company had $93.5 million of goodwill included in the Wholesale segment. Goodwill is not amortized but is tested at least annually in the fourth quarter for impairment or whenever events or changes in circumstances indicate that the carrying value may not be recoverable.
INTANGIBLE ASSETS
Within other assets, net, the Company has amortizable intangible assets consisting of reacquired rights with a gross carrying value of $49.1 million and accumulated amortization of $25.9 million and $19.0 million as of December 31, 2022 and 2021. Purchased intangible assets with finite lives are amortized over their estimated useful lives. Amortization expense related to amortizable intangible assets was $6.9 million for both years ended December 31, 2022 and 2021. Future amortization expense related to amortizable intangible assets will be approximately $6.9 million per year for the each of the years 2023 through 2025, $1.9 million for 2026, $0.3 million for 2027, and $0.4 million thereafter. The weighted-average amortization period for amortizable reacquired rights is 7 years.
NONCONTROLLING INTERESTS
The Company established several joint ventures either to distribute the Company’s products or to construct the Company’s domestic distribution facility. These joint ventures are variable interest entities (“VIE”), and the Company is considered the primary beneficiary. This determination is based on the relationships between the Company and the VIE, including management agreements, governance documents and other contractual arrangements. Specifically, the Company has both of the following characteristics: (a) the power to direct the activities of the entity that most significantly impact the entity’s economic performance; and (b) the obligation to absorb losses of the entity that could potentially be significant to the VIE, or the right to receive benefits from the entity that could potentially be significant to the VIE. The assets and liabilities and results of operations of these entities are included in the Company’s consolidated financial statements, even though the Company may not hold a majority equity interest.
In March 2021, the minority interest related to the Hong Kong joint venture was purchased for $10.0 million. The change in the Company’s ownership of the Hong Kong entity continues to be included in the Company’s consolidated financial statements. There have been no changes during 2022 in the accounting treatment or characterization of any previously identified VIEs. The Company continues to reassess these relationships based on events and circumstances. The assets of these joint ventures are restricted, as they are not available for general business use outside the context of such joint ventures. The holders of the liabilities of each joint venture have no recourse to the Company.
32
FOREIGN CURRENCY TRANSLATION
The Company’s reporting currency is the U.S. dollar. Certain international operations use the respective local currency as their functional currency, while others use the U.S. dollar as their functional currency. Translation adjustments for subsidiaries with non-U.S. dollar functional currencies are included in other comprehensive income. Foreign currency transaction gains (losses), resulting from exchange rate fluctuations, on transactions denominated in a currency other than the functional currency are reported in earnings. Assets and liabilities of subsidiaries with non-U.S. dollar functional currencies are translated at the balance sheet date exchange rate. Net earnings and cash flow items are translated at the weighted-average exchange rates during the period. Translations of intercompany loans of a long-term investment nature are included as a component of translation adjustment in other comprehensive income.
FAIR VALUE OF FINANCIAL INSTRUMENTS
The fair value hierarchy as defined by applicable accounting standards prioritizes the use of inputs used in valuation techniques into the following three levels:
|
|
• |
Level 1: Quoted market prices in active markets for identical assets or liabilities. |
|
|
• |
Level 2: Other observable market-based inputs or unobservable inputs that are corroborated by market data. |
|
|
• |
Level 3: Unobservable inputs that cannot be corroborated by market data that reflect the reporting entity’s own assumptions. |
The Company’s Level 1 investments primarily include money market funds and U.S. Treasury securities; Level 2 investments primarily include corporate notes and bonds, asset-backed securities, and actively traded mutual funds; and the Company does not currently have any Level 3 assets or liabilities. The Company has one Level 2 derivative instrument which is an interest rate swap (see Note 6 – Financial Commitments) classified as other assets, net at both December 31, 2022 and 2021. The fair value of the interest rate swap was determined using the market standard methodology of netting the discounted future fixed cash payments and the discounted expected variable cash receipts. The variable cash receipt was based on an expectation of future interest rates (forward curves) derived from observable market interest rate curves. Credit valuation adjustments were incorporated to appropriately reflect both the Company’s nonperformance risk and the respective counterparty’s nonperformance risk in the fair value measurements.
The carrying amount of receivables, payables and other amounts arising out of the normal course of business approximates fair value because of the relatively short maturity of such instruments. The carrying amount of the Company’s short-term and long-term borrowings, which are considered Level 2 liabilities, approximates fair value based on current rates and terms available to the Company for similar debt.
DERIVATIVE INSTRUMENTS
The Company’s objectives in using interest rate derivatives are to add stability to interest expense and to manage exposure to interest rate movements. To accomplish this objective, the Company uses an interest rate swap as part of its interest rate risk management strategy. The Company’s interest rate swap, designated as a cash flow hedge, involves the receipt of variable amounts from a counterparty in exchange for making fixed-rate payments over the life of the agreements without exchange of the underlying notional amount. By utilizing an interest rate swap, the Company is exposed to credit-related losses in the event that the counterparty fails to perform under the terms of the derivative contract. To mitigate this risk, the Company enters into derivative contracts with major financial institutions based upon credit ratings and other factors. As of December 31, 2022, all counterparties to the interest rate swap had performed in accordance with their contractual obligations.
RECENT ACCOUNTING PRONOUNCEMENTS
In March 2020, the FASB issued ASU 2020-04 Reference Rate Reform (Topic 848): Facilitation of the Effects of Reference Rate Reform on Financial Reporting, as amended and supplemented by subsequent ASUs (collectively, “ASU 2020-04” and “ASU 2022-06”), which provides practical expedients for contract modifications and certain hedging relationships associated with the transition from reference rates that are expected to be discontinued. This guidance is applicable for borrowing instruments, which use LIBOR as a reference rate, and is available through December 31, 2024. The Company has evaluated this ASU and does not expect its adoption to have a material impact on its consolidated financial statements.
33
|
(2) |
Cash, Cash Equivalents, Short-term and Long-term Investments |
The following tables show the Company’s cash, cash equivalents, short-term and long-term investments by significant investment category:
|
|
|
As of December 31, 2022 |
|
|
(in thousands) |
|
Adjusted Cost |
|
|
Fair Value |
|
|
Cash and Cash Equivalents |
|
|
Short-Term Investments |
|
|
Long-Term Investments |
|
|
Cash |
|
$ |
539,730 |
|
|
$ |
539,730 |
|
|
$ |
539,730 |
|
|
$ |
— |
|
|
$ |
— |
|
|
Level 1 |
|
|
|
|
|
|
|
|
|
|
|
|
|
|
|
|
|
|
|
|
|
Money market funds |
|
|
71,503 |
|
|
|
71,503 |
|
|
|
71,503 |
|
|
|
— |
|
|
|
— |
|
|
U.S. Treasury securities |
|
|
18,201 |
|
|
|
18,201 |
|
|
|
2,000 |
|
|
|
16,201 |
|
|
|
— |
|
|
Total level 1 |
|
|
89,704 |
|
|
|
89,704 |
|
|
|
73,503 |
|
|
|
16,201 |
|
|
|
— |
|
|
Level 2 |
|
|
|
|
|
|
|
|
|
|
|
|
|
|
|
|
|
|
|
|
|
Corporate notes and bonds |
|
|
101,959 |
|
|
|
101,959 |
|
|
|
2,500 |
|
|
|
85,731 |
|
|
|
13,728 |
|
|
Asset-backed securities |
|
|
4,641 |
|
|
|
4,641 |
|
|
|
— |
|
|
|
234 |
|
|
|
4,407 |
|
|
Mutual funds |
|
N/A |
|
|
|
5,893 |
|
|
|
— |
|
|
|
— |
|
|
|
5,893 |
|
|
Total level 2 |
|
|
106,600 |
|
|
|
112,493 |
|
|
|
2,500 |
|
|
|
85,965 |
|
|
|
24,028 |
|
|
Total |
|
$ |
736,034 |
|
|
$ |
741,927 |
|
|
$ |
615,733 |
|
|
$ |
102,166 |
|
|
$ |
24,028 |
|
|
|
|
As of December 31, 2021 |
|
|
(in thousands) |
|
Adjusted Cost |
|
|
Fair Value |
|
|
Cash and Cash Equivalents |
|
|
Short-Term Investments |
|
|
Long-Term Investments |
|
|
Cash |
|
$ |
664,220 |
|
|
$ |
664,220 |
|
|
$ |
664,220 |
|
|
$ |
— |
|
|
$ |
— |
|
|
Level 1 |
|
|
|
|
|
|
|
|
|
|
|
|
|
|
|
|
|
|
|
|
|
Money market funds |
|
|
132,063 |
|
|
|
132,063 |
|
|
|
132,063 |
|
|
|
— |
|
|
|
— |
|
|
U.S. Treasury securities |
|
|
25,437 |
|
|
|
25,437 |
|
|
|
— |
|
|
|
8,896 |
|
|
|
16,541 |
|
|
Total level 1 |
|
|
157,500 |
|
|
|
157,500 |
|
|
|
132,063 |
|
|
|
8,896 |
|
|
|
16,541 |
|
|
Level 2 |
|
|
|
|
|
|
|
|
|
|
|
|
|
|
|
|
|
|
|
|
|
Corporate notes and bonds |
|
|
148,373 |
|
|
|
148,373 |
|
|
|
— |
|
|
|
84,783 |
|
|
|
63,590 |
|
|
Asset-backed securities |
|
|
17,180 |
|
|
|
17,180 |
|
|
|
— |
|
|
|
4,901 |
|
|
|
12,279 |
|
|
Mutual funds |
|
N/A |
|
|
|
4,301 |
|
|
|
— |
|
|
|
— |
|
|
|
4,301 |
|
|
Total level 2 |
|
|
165,553 |
|
|
|
169,854 |
|
|
|
— |
|
|
|
89,684 |
|
|
|
80,170 |
|
|
Total |
|
$ |
987,273 |
|
|
$ |
991,574 |
|
|
$ |
796,283 |
|
|
$ |
98,580 |
|
|
$ |
96,711 |
|
The Company’s investments consist of U.S. Treasury securities, corporate notes and bonds, and asset-backed securities, which the Company has the intent and ability to hold to maturity and therefore are classified as held-to-maturity. The Company holds mutual funds in its deferred compensation plan which are classified as trading securities. The Company may sell certain of its investments prior to their stated maturities for strategic reasons including, but not limited to, anticipation of credit deterioration and duration management. The maturities of the Company’s long-term investments are less than two years. The Company minimizes the potential risk of principal loss by investing in highly-rated securities and limiting the amount of credit exposure to any one issuer. Fair values were determined for each individual security in the investment portfolio. Included in long-term investments are company owned life insurance contracts of $46.5 million and $48.9 million as of December 31, 2022, and December 31, 2021. Interest income was $6.0 million, $3.3 million, and $5.9 million for the years ended December 31, 2022, 2021 and 2020.
When evaluating an investment for its current expected credit losses, the Company reviews factors such as historical experience with defaults, losses, credit ratings, term and macroeconomic trends, including current conditions and forecasts to the extent they are reasonable and supportable.
The Company regularly enters into non-cancellable operating leases for retail stores, distribution facilities, offices, showrooms and automobiles. Retail stores typically have initial terms ranging from 5 to 10 years and other real estate or facility leases may have initial lease terms of up to 20 years. The Company’s leases are recorded as operating lease right-of-use (“ROU”) assets and operating leases liabilities. Operating lease liabilities are recognized based on the present value of the fixed portion of lease payments over the lease term at the commencement date. Net present value is calculated using an incremental borrowing rate based on a combination of market-based factors, such as market quoted forward yield curves and Company specific factors, such as lease size and duration. Many of the Company’s real estate leases include options to extend and are included in the lease obligations when considered reasonably certain. ROU assets are recognized based on operating lease liabilities reduced by lease incentives and initial direct costs incurred. Fixed lease cost is recognized on a straight-line basis over the lease term.
34
The Company’s real estate leases may require additional payments for percentage rent, real estate taxes, or other occupancy-related costs. Percentage rent, a variable cost, is recognized in the consolidated financial statements when incurred and is based on the specific terms in the lease agreement. Real estate taxes and other occupancy-related costs are non-lease components.
Operating lease cost and other information:
|
|
|
Year Ended December 31, |
|
|
(in thousands) |
|
2022 |
|
|
2021 |
|
|
Fixed lease cost |
|
$ |
307,265 |
|
|
$ |
290,509 |
|
|
Variable lease cost |
|
|
10,803 |
|
|
|
5,354 |
|
|
Operating cash flows used for leases |
|
|
303,721 |
|
|
|
286,411 |
|
|
Weighted-average remaining lease term |
|
5.52 years |
|
|
5.95 years |
|
|
Weighted-average discount rate |
|
|
3.12 |
% |
|
|
3.07 |
% |
The following table presents future lease payments as of December 31, 2022:
|
Year (in thousands) |
|
Operating Leases |
|
|
2023 |
|
$ |
283,449 |
|
|
2024 |
|
|
261,098 |
|
|
2025 |
|
|
232,949 |
|
|
2026 |
|
|
191,370 |
|
|
2027 |
|
|
158,529 |
|
|
Thereafter |
|
|
329,775 |
|
|
Total lease payments |
|
|
1,457,170 |
|
|
Less: Imputed interest |
|
|
(154,804 |
) |
|
Operating lease liabilities |
|
$ |
1,302,366 |
|
As of December 31, 2022, the Company has operating leases, primarily for new retail stores, that have not yet commenced which will generate additional ROU assets of $35.0 million.
|
(4) |
Property, Plant and Equipment |
Property, plant and equipment is summarized as follows:
|
|
|
As of December 31, |
|
|
(in thousands) |
|
2022 |
|
|
2021 |
|
|
Land |
|
$ |
122,433 |
|
|
$ |
111,212 |
|
|
Buildings and improvements |
|
|
634,683 |
|
|
|
658,910 |
|
|
Furniture, fixtures and equipment |
|
|
803,043 |
|
|
|
584,059 |
|
|
Leasehold improvements |
|
|
612,610 |
|
|
|
497,646 |
|
|
Total property, plant and equipment |
|
|
2,172,769 |
|
|
|
1,851,827 |
|
|
Less accumulated depreciation and amortization |
|
|
827,399 |
|
|
|
722,918 |
|
|
Property, plant and equipment, net |
|
$ |
1,345,370 |
|
|
$ |
1,128,909 |
|
Depreciation expense was $131.3 million, $122.2 million and $115.5 million for the years ended December 31, 2022, 2021 and 2020 as calculated using the straight-line method.
Accrued expenses at December 31, 2022 and 2021 are summarized as follows:
|
|
|
As of December 31, |
|
|
(in thousands) |
|
2022 |
|
|
2021 |
|
|
Accrued payroll, taxes, and other |
|
$ |
143,664 |
|
|
$ |
143,295 |
|
|
Return reserve liability |
|
|
60,482 |
|
|
|
68,944 |
|
|
Accrued inventory purchases |
|
|
89,997 |
|
|
|
53,181 |
|
|
Accrued expenses |
|
$ |
294,143 |
|
|
$ |
265,420 |
|
|
(6) |
Financial Commitments |
The Company had $2.7 million and $17.2 million of outstanding letters of credit as of December 31, 2022 and December 31, 2021, and approximately $19.6 million and $1.2 million in short-term borrowings as of December 31, 2022 and December 31, 2021. Interest expense for the years ended December 31, 2022, 2021 and 2020 was $19.7 million, $14.9 million and $16.3 million.
35
Long-term borrowings were as follows:
|
|
|
As of December 31, |
|
|
(in thousands) |
|
|
2022 |
|
|
|
2021 |
|
|
HF-T1 Distribution Center Loan |
|
$ |
129,505 |
|
|
$ |
129,505 |
|
|
HF-T2 Distribution Center Construction Loan |
|
|
72,098 |
|
|
|
57,227 |
|
|
China Distribution Center Construction Loan |
|
|
41,329 |
|
|
|
75,621 |
|
|
China Distribution Center Expansion Construction Loan |
|
|
14,507 |
|
|
|
— |
|
|
China Operational Loans |
|
|
54,361 |
|
|
|
69,796 |
|
|
Other |
|
|
7,872 |
|
|
|
8,263 |
|
|
Subtotal |
|
|
319,672 |
|
|
|
340,412 |
|
|
Less: Current installments |
|
|
103,184 |
|
|
|
76,967 |
|
|
Total long-term borrowings |
|
$ |
216,488 |
|
|
$ |
263,445 |
|
Revolving Credit Facility
The Company maintains a revolving credit facility to manage liquidity; including working capital and capital expenditures. On December 15, 2021, the Company amended its $500.0 million senior, unsecured revolving credit agreement dated November 21, 2019 (the “Amended Credit Agreement”), with Bank of America, N.A., as administrative agent and joint lead arranger, HSBC Bank USA, N.A. and JPMorgan Chase Bank, N.A., as joint lead arrangers, and other lenders. The Amended Credit Agreement expands its senior, unsecured credit facility to $750.0 million, which may be increased by up to $250.0 million under certain conditions and provides for the issuance of letters of credit up to a maximum of $100.0 million and swingline loans up to a maximum of $50.0 million. The Amended Credit Agreement extends the maturity date of the credit agreement, which was due to expire on November 21, 2024, to December 15, 2026. The Company may use the proceeds from the Amended Credit Agreement for working capital and other lawful corporate purposes. Borrowings on the Amended Credit Agreement’s revolving credit facility and letters of credit bear interest, at the Company’s option, at a rate equal to (a) Term SOFR plus an applicable margin between 1.000% and 1.500% based upon the Company’s Total Adjusted Net Leverage Ratio (as defined in the Amended Credit Agreement) or (b) a base rate (defined as the highest of (i) the Federal Funds Rate plus 0.50%, (ii) the Bank of America prime rate, (iii) Term SOFR plus 1.00%, and (iv) 1.00%) plus an applicable margin between 0% and 0.500% based upon the Company’s Total Adjusted Net Leverage Ratio. The weighted-average annual interest rate on borrowings under the revolving credit facility was approximately 3.21% during the year ended December 31, 2022. The Amended Credit Agreement contains certain customary affirmative and negative covenants and events of default for credit facilities of this type.
The Amended Credit Agreement requires the Company to maintain a maximum Total Adjusted Net Leverage Ratio of 3.75:1, except in the event of an acquisition in which case the ratio may be increased at the Company’s election to 4.25:1 for the quarter in which such acquisition occurs and for the next three quarters thereafter.
As of December 31, 2022, there was $747.3 million available under the Company’s Amended Credit Agreement. As of December 31, 2021, the unused credit capacity of the revolving credit facility was $732.8 million. The Company was in compliance with the financial covenants under the Amended Credit Agreement as of December 31, 2022.
HF-T1 Distribution Center Loan
To finance construction and improvements to the Company’s North American distribution center, the Company’s joint venture with HF Logistics I, LLC (“HF”), HF Logistics-SKX, LLC (the “JV”), through a wholly-owned subsidiary of the JV (“HF-T1”), entered into an amended and restated construction loan agreement with Bank of America, N.A., as administrative agent and as a lender, and CIT Bank, N.A. and Raymond James Bank, N.A., as lenders (collectively, the “Amended Construction Loan Agreement”). Under the Amended Construction Loan Agreement, the parties agreed that the lenders would loan $70 million to HF-T1 (the “2015 Loan”) at an interest rate per annum of LIBOR Daily Floating Rate (as defined therein) plus a margin of 2%. On March 18, 2020, HF-T1 entered into an amendment to the 2015 Loan (the “2020 Amendment”) that increased the borrowings under the 2015 Loan to $129.5 million and extended the maturity date of the 2015 Loan to March 18, 2025 (the “HF-T1 2020 Loan”). The proceeds of the 2020 Amendment were used by the JV to (i) refinance all amounts owed on the 2015 Loan, (ii) pay $1.0 million in accrued interest, loan fees and other closing costs associated with the 2020 Amendment and (iii) make a distribution of $64.4 million to HF. Pursuant to the 2020 Amendment, the interest rate per annum on the HF-T1 2020 Loan is the LIBOR Daily Floating Rate (as defined therein) plus a margin of 1.75%.
HF-T1 also entered into an ISDA master agreement (together with the schedule related thereto, the “Swap Agreement”) with Bank of America, N.A. to govern derivative and/or hedging transactions that HF-T1 concurrently entered into with Bank of America, N.A. Pursuant to the Swap Agreement, on August 14, 2015, HF-T1 entered into a confirmation of swap transactions (the “Interest Rate Swap”) as amended (the “Swap Agreement Amendment”) on March 18, 2020 with Bank of America, N.A with a maturity date of March 18, 2025. The Swap Agreement Amendment fixes the effective interest rate on the HF-T1 2020 Loan at 2.55% per annum. The HF-T1 2020 Loan and Swap Agreement Amendment are subject to customary covenants and events of default. Bank of America, N.A. also acts as a lender and syndication agent under the Company’s revolving credit facility.
36
As of December 31, 2022, the Interest Rate Swap had an aggregate notional amount of $129.5 million. Under the terms of the Swap Agreement Amendment, the Company will pay a weighted-average fixed rate of 0.795% on the notional amount and receive payments from the counterparty based on the 30-day LIBOR rate, effectively modifying the Company’s exposure to interest rate risk by converting floating-rate debt to a fixed rate of 4.08%. The Company continually assesses the creditworthiness of its counterparties.
HF-T2 Distribution Center Construction Loan
On April 3, 2020, the JV, through HF Logistics-SKX T2, LLC, a wholly-owned subsidiary of the JV (“HF-T2”), entered into a construction loan agreement with Bank of America, N.A. as administrative agent and lender (collectively, the “2020 Construction Loan Agreement”), pursuant to which the JV obtained a loan of up to $73.0 million used to expand the North American distribution center (the “HF-T2 2020 Construction Loan”). Under the 2020 Construction Loan Agreement, the interest rate per annum on the HF-T2 2020 Construction Loan is based on the Bloomberg Short-Term Bank Yield Index (“BSBY”) Daily Floating Rate (as defined therein) plus a margin of 190 basis points, reducing to 175 basis points upon substantial completion of the construction and certain other conditions being satisfied. The weighted-average annual interest rate on borrowings under the 2020 Construction Loan Agreement was approximately 4.22% during the year ended December 31, 2022. The maturity date of the HF-T2 2020 Construction Loan is April 3, 2025. The obligations of the JV under the 2020 Construction Loan Agreement are guaranteed by TGD Holdings I, LLC, which is an affiliate of HF.
China Distribution Center Construction Loan
On September 29, 2018, through its Taicang subsidiary (“TC Subsidiary”), the Company entered into a 700.0 million yuan loan agreement with China Construction Bank Corporation (“the China DC Loan”) to finance the construction of the Company’s distribution center in China. Interest is paid quarterly. The interest rate floats and is calculated at a reference rate provided by the People’s Bank of China. The interest rate at December 31, 2022 was 4.00% and may increase or decrease over the life of the loan, and is evaluated every 12 months. Beginning in 2021, the principal of the loan is repaid in semi-annual installments of variable amounts. The China DC Loan contains customary affirmative and negative covenants for secured credit facilities of this type. The China DC Loan matures on September 28, 2023. The obligations of the TC Subsidiary under the China DC Loan are jointly and severally guaranteed by the Company’s China joint venture. As of December 31, 2022 and 2021, the outstanding balance under this loan included approximately $41.3 million and $28.2 million classified as current borrowings in the Company’s consolidated balance sheets.
China Distribution Center Expansion Construction Loan
On October 18, 2022, the Company entered into a loan agreement for 1.1 billion yuan with Bank of China Co., Ltd to finance the construction of its distribution center expansion in China. Interest is paid quarterly. The interest rate at December 31, 2022 was 3.4% and may increase or decrease over the life of the loan, and is evaluated every 12 months. This loan matures 10 years from the initial receipt of funds. Beginning in 2026, the principal of the loan will be repaid in semi-annual installments of variable amounts. The obligations of this loan entered through the Company’s Taicang Subsidiary are jointly and severally guaranteed by the Company’s China joint venture.
China Operational Loans
The Company has entered certain secured credit facilities to support the operations of its China joint venture. The balance of working capital loans at December 31, 2022 was approximately $54.4 million with interest rates ranging from 2.90% to 3.41% per annum, payable at terms agreed by the lender. The balance of working capital loans as of December 31, 2021 was approximately $52.6 million with interest rates ranging from 1.00% to 3.70% per annum. The balance of loans related to a corporate office building in Shanghai was zero as of December 31, 2022 and approximately $17.2 million as of December 31, 2021 with interest at 4.28% per annum, payable at terms agreed by the lender. As of December 31, 2022, the outstanding balances classified as current borrowings in the Company’s consolidated balance sheets included $54.4 million related to the working capital loans.
The following table presents the future principal payments required under the Company’s debt obligations, discussed above:
|
Year (in thousands) |
|
Maturities |
|
|
2023 |
|
$ |
103,184 |
|
|
2024 |
|
|
— |
|
|
2025 |
|
|
201,981 |
|
|
2026 |
|
|
1,846 |
|
|
2027 |
|
|
1,846 |
|
|
Thereafter |
|
|
10,815 |
|
|
|
|
$ |
319,672 |
|
37
|
(7) |
Commitments and Contingencies |
PRODUCT AND OTHER FINANCING
The Company finances production activities in part through the use of interest-bearing open purchase arrangements with certain of its international manufacturers. These arrangements currently bear interest at rates between 0.0% and 0.4% for 30- to 60-day financing. The amounts included in accounts payable and outstanding under these arrangements were $345.4 million and $337.0 million at December 31, 2022 and 2021. Interest expense incurred by the Company under these arrangements totaled $6.1 million in 2022, $6.5 million in 2021, and $7.4 million in 2020. The Company has open purchase commitments with its foreign manufacturers of $1.1 billion and warehouse and equipment and corporate construction contracts of $252.1 million for the expansion of its distribution centers and corporate headquarters, which are not included in the consolidated balance sheets at December 31, 2022.
LITIGATION
In accordance with GAAP, the Company records a liability in its consolidated financial statements for loss contingencies when a loss is known or considered probable and the amount can be reasonably estimated. When determining the estimated loss or range of loss, significant judgment is required to estimate the amount and timing of a loss to be recorded. Estimates of probable losses resulting from litigation and governmental proceedings are inherently difficult to predict, particularly when the matters are in the procedural stages or with unspecified or indeterminate claims for damages, potential penalties, or fines. Accordingly, the Company cannot determine the final amount, if any, of its liability beyond the amount accrued in the consolidated financial statements as of December 31, 2022, nor is it possible to estimate what litigation-related costs will be in the future; however, the Company believes that the likelihood that claims related to litigation would result in a material loss to the Company, either individually or in the aggregate, is remote. The Company recognizes legal expense in connection with loss contingencies as incurred.
|
(8) |
Stockholders’ Equity and Stock Compensation |
COMMON STOCK
The authorized capital stock of the Company consists of 500 million shares of Class A Common Stock, par value $0.001 per share (“Class A Common Stock”), 75 million shares of Class B Common Stock, par value $0.001 per share (“Class B Common Stock”), and 10 million shares of Preferred Stock, par value $0.001 per share.
The Company has two classes of issued and outstanding common stock: Class A Common Stock and Class B Common Stock. Holders of Class A Common Stock and holders of Class B Common Stock have substantially identical rights, including rights with respect to any declared dividends or distributions of cash or property, and the right to receive proceeds on liquidation or dissolution of the Company after payment of the Company’s indebtedness. The two classes have different voting rights, with holders of Class A Common Stock entitled to one vote per share while holders of Class B Common Stock are entitled to ten votes per share on all matters submitted to a vote of stockholders. The Company uses the two-class method for calculating net earnings per share (EPS). Basic and diluted net EPS of Class A Common Stock and Class B Common Stock are identical. The shares of Class B Common Stock are convertible at any time at the option of the holder into shares of Class A Common Stock on a share-for-share basis. In addition, shares of Class B Common Stock will be automatically converted into a like number of shares of Class A Common Stock upon transfer to any person or entity who is not a permitted transferee.
During the years ended December 31, 2022, 2021 and 2020 certain Class B stockholders converted 128,530, 77,562 and 1,391,670 shares, respectively, of Class B Common Stock to Class A Common Stock.
SHARE REPURCHASE PROGRAM
On January 31, 2022, the Company's Board of Directors authorized a new share repurchase program (the “Share Repurchase Program”), pursuant to which the Company may, from time to time, purchase shares of its Class A Common Stock, for an aggregate repurchase price not to exceed $500 million. The Share Repurchase Program expires on January 31, 2025 and does not obligate the Company to acquire any particular amount of shares.
The following table provides a summary of the Company’s stock repurchase activities:
|
|
|
Year Ended December 31, |
|
|
|
|
2022 |
|
|
2021 |
|
|
Shares repurchased |
|
|
1,926,781 |
|
|
|
— |
|
|
Average cost per share |
|
$ |
38.53 |
|
|
$ |
— |
|
|
Total cost of shares repurchased (in thousands) |
|
$ |
74,245 |
|
|
$ |
— |
|
38
INCENTIVE AWARD PLAN
A total of 10,000,000 shares of Class A Common Stock were reserved for issuance under the 2017 Incentive Award Plan (the “Plan”). The Plan provides for grants of ISOs, non-qualified stock options, restricted stock and various other types of equity awards as described in the Plan to employees, consultants and directors of the Company. The Plan is administered by the Company’s Board of Directors with respect to awards to non-employee directors and by the Company’s Compensation Committee with respect to other eligible participants.
For the year ended December 31, 2022, the Company granted restricted stock with time-based vesting as well as performance-based awards. The performance-based awards include a market condition tied to the Company’s total shareholder return in relation to its peer companies as well as a financial performance condition tied to annual EPS growth. The vesting and ultimate payout of performance awards is determined at the end of the three-year performance period and can vary from zero to 200% based on actual results. As of December 31, 2022, a total of 2,749,532 shares remain available for grant as equity awards under the Plan if target levels are achieved for performance-based awards and 2,049,532 available if maximum levels are achieved.
The Company issued the following stock-based instruments:
|
|
|
Year Ended December 31, |
|
|
|
|
2022 |
|
|
2021 |
|
|
2020 |
|
|
|
|
Granted |
|
|
Weighted-Average Grant-Date Fair Value |
|
|
Granted |
|
|
Weighted-Average Grant-Date Fair Value |
|
|
Granted |
|
|
Weighted-Average Grant-Date Fair Value |
|
|
Restricted stock |
|
|
1,446,550 |
|
|
$ |
38.27 |
|
|
|
1,201,600 |
|
|
$ |
42.88 |
|
|
|
1,319,300 |
|
|
$ |
36.42 |
|
|
Performance-based restricted stock |
|
|
116,250 |
|
|
$ |
42.46 |
|
|
|
108,750 |
|
|
$ |
38.95 |
|
|
|
125,000 |
|
|
$ |
36.02 |
|
|
Market-based restricted stock |
|
|
116,250 |
|
|
$ |
58.85 |
|
|
|
108,750 |
|
|
$ |
54.34 |
|
|
|
125,000 |
|
|
$ |
49.78 |
|
A summary of the status and changes of the Company’s unvested shares related to the Plan is presented below:
|
|
|
Shares |
|
|
Weighted-Average Grant-Date Fair Value |
|
|
Unvested at January 1, 2020 |
|
|
3,426,823 |
|
|
|
32.55 |
|
|
Granted |
|
|
1,569,300 |
|
|
|
37.45 |
|
|
Vested/Released |
|
|
(1,093,500 |
) |
|
|
32.64 |
|
|
Cancelled |
|
|
(790,600 |
) |
|
|
32.23 |
|
|
Unvested at December 31, 2020 |
|
|
3,112,023 |
|
|
|
35.06 |
|
|
Granted |
|
|
1,419,100 |
|
|
|
43.46 |
|
|
Vested/Released |
|
|
(1,252,108 |
) |
|
|
34.36 |
|
|
Cancelled |
|
|
(25,699 |
) |
|
|
39.01 |
|
|
Unvested at December 31, 2021 |
|
|
3,253,316 |
|
|
|
38.97 |
|
|
Granted |
|
|
1,679,050 |
|
|
|
39.98 |
|
|
Vested/Released |
|
|
(1,423,531 |
) |
|
|
36.13 |
|
|
Cancelled |
|
|
(84,933 |
) |
|
|
39.72 |
|
|
Unvested at December 31, 2022 |
|
|
3,423,902 |
|
|
|
40.62 |
|
The Company determines the fair value of restricted stock awards and any performance-related components based on the closing market price of the Company’s common stock on the date of grant. For share-based awards with a performance-based vesting requirement, the Company evaluates the probability of achieving the performance criteria throughout the performance period and will adjust stock compensation expense up or down based on its estimated probable outcome. Certain performance-based awards contain market condition components which are valued on the date of grant using a Monte Carlo simulation model. The fair value of such awards is expensed ratably over the performance period and is not adjusted for actual achievement.
The Company recognized, as part of general and administrative, compensation expense of $57.3 million, $57.9 million and $62.9 million for grants under the Plan for the years ended December 31, 2022, 2021, and 2020. Related excess income tax expenses, recorded in the consolidated statements of earnings, for the years ended December 31, 2022, 2021 and 2020, were $(1.3) million, $(1.0) million, and $(0.7) million. Nonvested shares generally vest over a graded vesting schedule from one to four years from the date of grant. For grants that have a service requirement, the Company accounts for forfeitures upon occurrence, rather than estimating the probability of forfeiture at the date of grant. Accordingly, the Company recognizes the full grant-date fair value of these awards on a straight-line basis throughout the requisite service period, reversing any expense if, and only if, there is a forfeiture. There was $88.7 million of unrecognized compensation cost related to nonvested common shares as of December 31, 2022, which is expected to be recognized over a weighted-average period of 1.81 years. The total fair value of shares vested during the years ended December 31, 2022, 2021 and 2020 was $51.4 million, $43.1 million and $41.6 million.
39
STOCK PURCHASE PLAN
As approved by the Company’s stockholders on May 23, 2017, the 2018 Employee Stock Purchase Plan (the “2018 ESPP”) provides a total of 5,000,000 shares of Class A Common Stock for sale. The 2018 ESPP provides eligible employees of the Company and its subsidiaries the opportunity to purchase shares of the Company’s Class A Common Stock at a purchase price equal to 85% of the fair market value on the first trading day or last trading day of each purchase period, whichever is lower. Eligible employees can invest up to 15% of their compensation through payroll deductions during each purchase period. The purchase price discount and the look-back feature cause the 2018 ESPP to be compensatory and the Company recognizes compensation expense, which is computed using the Black-Scholes valuation model.
For the years ended December 31, 2022, 2021 and 2020, the Company recognized $2.6 million, $2.2 million, and $2.3 million of ESPP stock compensation expense. Under the 2018 ESPP, the Company received approximately $8.1 million, $7.3 million and $5.9 million, and issued 243,166, 225,665 and 232,904 shares, respectively, for the years ended December 31, 2022, 2021 and 2020. As of December 31, 2022, there were 3,815,746 shares available for sale under the 2018 ESPP.
Basic EPS and diluted EPS are calculated by dividing net earnings by the following: for basic EPS, the weighted-average number of common shares outstanding for the period; and for diluted EPS, the sum of the weighted-average number of both outstanding common shares and potentially dilutive common shares using the treasury stock method.
The calculation of EPS is as follows:
|
|
|
Year Ended December 31, |
|
|
(in thousands, except per share data) |
|
2022 |
|
|
2021 |
|
|
2020 |
|
|
Net earnings attributable to Skechers U.S.A., Inc. |
|
$ |
373,028 |
|
|
$ |
741,503 |
|
|
$ |
98,564 |
|
|
|
|
|
|
|
|
|
|
|
|
|
|
|
|
Weighted-average common shares outstanding, basic |
|
|
155,627 |
|
|
|
155,539 |
|
|
|
154,184 |
|
|
Dilutive effect of nonvested shares |
|
|
981 |
|
|
|
1,255 |
|
|
|
710 |
|
|
Weighted-average common shares outstanding, diluted |
|
|
156,608 |
|
|
|
156,794 |
|
|
|
154,894 |
|
|
Anti-dilutive common shares excluded above |
|
|
37 |
|
|
|
5 |
|
|
|
69 |
|
|
Net earnings attributable to Skechers U.S.A., Inc. per common share: |
|
|
|
|
|
|
|
|
|
|
|
|
|
Basic |
|
$ |
2.40 |
|
|
$ |
4.77 |
|
|
$ |
0.64 |
|
|
Diluted |
|
$ |
2.38 |
|
|
$ |
4.73 |
|
|
$ |
0.64 |
|
The Company’s earnings before income tax expense consists of the following:
|
|
|
Year Ended December 31, |
|
|
(in thousands) |
|
2022 |
|
|
2021 |
|
|
2020 |
|
|
U.S. operations |
|
$ |
(48,311 |
) |
|
$ |
71,900 |
|
|
$ |
(112,671 |
) |
|
Foreign operations |
|
|
570,568 |
|
|
|
497,857 |
|
|
|
267,400 |
|
|
Earnings before income taxes |
|
$ |
522,257 |
|
|
$ |
569,757 |
|
|
$ |
154,729 |
|
Income tax consists of the following:
|
|
|
Year Ended December 31, |
|
|
(in thousands) |
|
2022 |
|
|
2021 |
|
|
2020 |
|
|
Current |
|
|
|
|
|
|
|
|
|
|
|
|
|
Federal |
|
$ |
256 |
|
|
$ |
34,288 |
|
|
$ |
(30,094 |
) |
|
State |
|
|
9,564 |
|
|
|
7,268 |
|
|
|
3,841 |
|
|
Foreign |
|
|
84,904 |
|
|
|
102,062 |
|
|
|
56,530 |
|
|
|
|
|
94,724 |
|
|
|
143,618 |
|
|
|
30,277 |
|
|
Deferred |
|
|
|
|
|
|
|
|
|
|
|
|
|
Federal |
|
|
7,043 |
|
|
|
(27,074 |
) |
|
|
(2,208 |
) |
|
State |
|
|
(1,287 |
) |
|
|
(4,481 |
) |
|
|
(3,070 |
) |
|
Foreign |
|
|
(7,385 |
) |
|
|
(357,938 |
) |
|
|
(16,497 |
) |
|
|
|
|
(1,629 |
) |
|
|
(389,493 |
) |
|
|
(21,775 |
) |
|
Income tax expense (benefit) |
|
$ |
93,095 |
|
|
$ |
(245,875 |
) |
|
$ |
8,502 |
|
40
Income taxes differ from the statutory tax rates as applied to earnings before income taxes as follows:
|
|
|
Year Ended December 31, |
|
|
(in thousands) |
|
2022 |
|
|
2021 |
|
|
2020 |
|
|
Expected income tax expense |
|
$ |
109,674 |
|
|
$ |
119,649 |
|
|
$ |
32,493 |
|
|
State income tax, net of federal benefit |
|
|
(1,597 |
) |
|
|
(172 |
) |
|
|
(2,394 |
) |
|
Rate differential on foreign income |
|
|
(49,175 |
) |
|
|
(24,615 |
) |
|
|
(27,426 |
) |
|
Change in unrecognized tax benefits |
|
|
12,310 |
|
|
|
11,538 |
|
|
|
6,084 |
|
|
Intra-entity intellectual property transfer |
|
|
(3,232 |
) |
|
|
(346,776 |
) |
|
|
— |
|
|
FDII deduction |
|
|
— |
|
|
|
(10,695 |
) |
|
|
— |
|
|
Non-deductible compensation |
|
|
13,668 |
|
|
|
8,693 |
|
|
|
7,119 |
|
|
Tax credits |
|
|
(7,544 |
) |
|
|
(7,547 |
) |
|
|
(6,312 |
) |
|
Excess tax on stock compensation |
|
|
1,305 |
|
|
|
976 |
|
|
|
703 |
|
|
Benefits provided by the Coronavirus Aid, Relief, and Economic Security Act |
|
|
— |
|
|
|
(905 |
) |
|
|
(15,863 |
) |
|
Non-deductible share cancellation |
|
|
— |
|
|
|
— |
|
|
|
4,048 |
|
|
U.S. tax on foreign earnings |
|
|
7,611 |
|
|
|
— |
|
|
|
— |
|
|
Other |
|
|
217 |
|
|
|
(927 |
) |
|
|
(463 |
) |
|
Change in valuation allowance |
|
|
9,858 |
|
|
|
4,906 |
|
|
|
10,513 |
|
|
Income tax expense (benefit) |
|
$ |
93,095 |
|
|
$ |
(245,875 |
) |
|
$ |
8,502 |
|
|
Effective tax rate |
|
|
17.8 |
% |
|
|
(43.2 |
)% |
|
|
5.5 |
% |
The Company’s income tax expense (benefit) and effective income tax rate are significantly impacted by the mix of the Company’s domestic and foreign earnings (loss) before income taxes. In the non-U.S. jurisdictions in which the Company has operations, the applicable statutory rates are generally lower than in the U.S., ranging from 0.0% to 34.0%. The Company’s income tax expense (benefit) was calculated using the applicable rate for each jurisdiction applied to the Company’s pre-tax earnings (loss) while the Company’s effective tax rate is calculated by dividing income tax expense (benefit) by earnings before income taxes. For 2022, the effective tax rate was lower than the U.S. federal and state combined statutory rate of approximately 25%, primarily due to tax benefits related to earnings from foreign operations in jurisdictions imposing either lower tax rates on corporate earnings or no corporate income tax.
The Company is subject to a tax on global intangible low-taxed income (“GILTI”). GILTI taxes foreign income in excess of a deemed return on tangible assets of foreign corporations and is treated as a period cost.
The tax effects of temporary differences giving rise to deferred tax assets and liabilities are presented below:
|
|
|
As of December 31, |
|
|
(in thousands) |
|
2022 |
|
|
2021 |
|
|
Deferred tax assets |
|
|
|
|
|
|
|
|
|
Inventory adjustments |
|
$ |
10,810 |
|
|
$ |
9,099 |
|
|
Accrued expenses |
|
|
92,215 |
|
|
|
76,412 |
|
|
Allowances for bad debts and chargebacks |
|
|
4,728 |
|
|
|
4,667 |
|
|
Advance payment |
|
|
6,339 |
|
|
|
27,594 |
|
|
Intra-entity IP transfer |
|
|
343,106 |
|
|
|
346,776 |
|
|
Section 174 Capitalized Costs |
|
|
15,721 |
|
|
|
— |
|
|
Loss carryforwards |
|
|
50,558 |
|
|
|
38,273 |
|
|
Business credit carryforward |
|
|
25,289 |
|
|
|
15,537 |
|
|
Share-based compensation |
|
|
7,725 |
|
|
|
6,479 |
|
|
Operating lease liabilities |
|
|
317,449 |
|
|
|
337,399 |
|
|
Valuation allowance |
|
|
(58,321 |
) |
|
|
(48,463 |
) |
|
Total deferred tax assets |
|
|
815,619 |
|
|
|
813,773 |
|
|
Deferred tax liabilities |
|
|
|
|
|
|
|
|
|
Prepaid expenses |
|
|
5,073 |
|
|
|
4,116 |
|
|
Right-of-use assets |
|
|
317,449 |
|
|
|
337,371 |
|
|
Depreciation on property, plant and equipment |
|
|
47,563 |
|
|
|
32,751 |
|
|
Total deferred tax liabilities |
|
|
370,085 |
|
|
|
374,238 |
|
|
Net deferred tax assets |
|
$ |
445,534 |
|
|
$ |
439,535 |
|
41
At December 31, 2022, combined foreign net operating loss carry-forwards were approximately $176.7 million of which $3.7 million expire in 2023 and $34.3 million can be carried forward indefinitely. A valuation allowance of $58.3 million is recorded for the amount of deferred tax assets which is not likely to be fully utilized. The $9.9 million increase in the valuation allowance primarily relates to increases in deferred tax assets in certain foreign non-benefited loss jurisdictions.
In December 2021, the Company completed an intra-entity transfer of certain intellectual property rights to Switzerland primarily to align with current and future international operations. The transfer resulted in a step-up in the Swiss tax basis of intellectual property rights and a correlated increase in foreign deferred tax assets, based on the estimated fair value of the transferred intellectual property rights to be amortized. As a result, the Company recorded a tax benefit of $346.8 million, net of uncertain tax positions of $25.2 million. In 2022, the company obtained a tax ruling on the fair value of the transferred intellectual property rights, resulting in a settlement of the uncertain tax position and an adjusted recorded tax benefit of $349.6 million.
U.S. federal and net operating loss carry-forwards at December 31, 2022 was $35.0 million which can be carried forward indefinitely. U.S. federal tax credit carry-forward at December 31, 2022 was 12.6 million. State tax credit and net operating loss carry-forwards at December 31, 2022 were $15.4 million and $43.4 million. These tax credit and net operating loss carry-forward amounts begin to expire in 2030. No valuation allowance has been recorded, as the Company believes they will be fully utilized.
A reconciliation of the beginning and ending amount of unrecognized tax benefits is as follows:
|
|
|
As of December 31, |
|
|
(in thousands) |
|
2022 |
|
|
2021 |
|
|
Beginning balance |
|
$ |
66,951 |
|
|
$ |
21,511 |
|
|
Additions for current year tax positions |
|
|
5,345 |
|
|
|
34,975 |
|
|
Additions for prior year tax positions |
|
|
4,616 |
|
|
|
15,256 |
|
|
Reductions for prior year tax positions |
|
|
(674 |
) |
|
|
(361 |
) |
|
Settlement of uncertain tax positions |
|
|
(32,954 |
) |
|
|
(812 |
) |
|
Reductions related to lapse of statute of limitations |
|
|
(2,037 |
) |
|
|
(3,618 |
) |
|
Ending balance |
|
$ |
41,247 |
|
|
$ |
66,951 |
|
Current unrecognized tax benefits are recorded as a reduction in prepaid expense and included in tax expense when recorded. Long-term unrecognized tax benefits are recorded as an increase in long-term taxes payable with a portion included in tax expense and a portion recorded as a reduction in deferred tax liabilities when recorded. If recognized, $29.4 million of unrecognized tax benefits would be recorded as a reduction in income tax expense, and $11.8 million would be recorded as an increase in deferred tax liabilities.
The amount of income taxes the Company pays is subject to ongoing audits by taxing jurisdictions around the world. The Company’s estimate of the potential outcome of any uncertain tax position is subject to its assessment of relevant risks, facts, and circumstances existing at that time. The Company believes that it has adequately provided for these matters. However, the Company’s future results may include favorable or unfavorable adjustments to its estimates in the period the audits are resolved, which may impact the Company’s effective tax rate.
The Company estimates interest and penalties related to income tax matters which are included in income tax expense (benefits). Amounts were $(1.9) million, $3.6 million, and $0.3 million for the years ended December 31, 2022, 2021, and 2020. Accrued interest and penalties were $4.2 million and $6.2 million as of December 31, 2022 and 2021.
As of December 31, 2022, the Company’s tax filings are generally subject to examination in the U.S. and most foreign jurisdictions for years ending on or after December 31, 2018, and in several Asian and European tax jurisdictions for years ending on or after December 31, 2012. During the year, the Company reduced the balance of unrecognized tax benefits by $2.0 million as a result of expiring statutes and $33.0 million from the settlements and decision on a foreign tax ruling. The Company also released $2.3 million in interest during the year. It is reasonably possible that certain domestic and foreign statutes will expire and certain domestic and foreign audits will be settled during the next twelve months which would reduce the balance of 2022 and prior year unrecognized tax benefits by $1.2 million and $2.3 million.
The Company’s cash and cash equivalents held in the U.S. and cash provided from operations are sufficient to meet the Company’s liquidity needs in the U.S. for the next twelve months. However, the Company may repatriate certain funds held outside the U.S. for which all applicable U.S. and non-U.S. tax has been fully provided as of December 31, 2022. The Company has provided for the tax impact of expected distributions from its joint venture in China as well as from its subsidiary in Chile to its intermediate parent company in Switzerland. Otherwise, because of the need for cash for operating capital and continued overseas expansion, the Company does not foresee the need for any of its other foreign subsidiaries to distribute funds up to an intermediate foreign parent company in any form of taxable dividend. Under current applicable tax laws, if the Company chooses to repatriate some or all of the funds the Company has designated as indefinitely reinvested outside the U.S., the amount repatriated would not be subject to federal income tax but may be subject to applicable non-U.S. income and withholding taxes, and to certain state income taxes. In addition to certain tax restrictions, our joint venture in China has limitations on its distribution of earnings, as local law currently requires it to maintain $25.9 million of its earnings in a statutory reserve.
42
|
(11) |
Employee Benefit Plans |
The Company has a 401(k) profit sharing plan covering U.S. employees who are 21 years of age and have completed six months of service. The Company’s contribution is based on a non-discretionary match as defined by the plan which vests immediately. Company contributions for 2020 were discretionary and vested over six years. The Company made contributions of $4.2 million, $4.7 million, and $2.8 million to the plan for the years ended December 31, 2022, 2021, and 2020.
The Skechers U.S.A., Inc. Deferred Compensation Plan (the “Plan”) allows eligible employees to defer compensation up to a maximum amount to a future date on a nonqualified basis. The Plan provides for the Company to make discretionary contributions to participating employees as determined by the Company’s Compensation Committee. Contributions were zero, $0.1 million, and $0.3 million for the years ended December 31, 2022, 2021 and 2020. Deferred compensation is recognized based on the fair value of the participants’ accounts.
|
(12) |
Related Party Transactions |
The Skechers Foundation (the “Foundation”) is a 501(c)(3) non-profit entity and not a subsidiary or otherwise affiliated with the Company. The Company does not have a financial interest in the Foundation. However, two officers and directors of the Company, Michael Greenberg, the Company’s President, and David Weinberg, the Company’s Chief Operating Officer, are also officers and directors of the Foundation. During the years ended December 31, 2022, 2021, and 2020, the Company made contributions of $2.0 million, $3.0 million, and $2.3 million to the Foundation.
The Company had receivables from officers and employees of $1.9 million and $1.3 million at December 31, 2022 and 2021. These amounts relate to travel advances, incidental personal purchases on Company-issued credit cards and employee loans. These receivables are short-term and are expected to be repaid within a reasonable period of time. In March 2021, the Company purchased two properties for $2.7 million, from an entity controlled by its President, Michael Greenberg, to facilitate future expansion of the Company’s corporate office buildings in Manhattan Beach, California. The terms of the sale were no less favorable than could be obtained from an unrelated third party. The Company had no other significant transactions with or payables to officers, directors or significant stockholders of the Company.
|
(13) |
Segment and Geographic Information |
During the first quarter of 2022, the Company refined the way in which management assesses performance and allocates resources and now presents its reportable segment results as Wholesale and Direct-to-Consumer. Comparative periods have been recast to reflect these changes. Management continues to evaluate segment performance based primarily on sales and gross margin. Other costs and expenses of the Company are analyzed on an aggregate basis and not allocated to the segments. The following summarizes the Company’s operations by segment and geographic area:
Segment Information
|
|
|
Year Ended December 31, |
|
|
(in thousands) |
|
2022 |
|
|
2021 |
|
|
2020 |
|
|
Wholesale sales |
|
$ |
4,632,429 |
|
|
$ |
3,758,640 |
|
|
$ |
2,835,010 |
|
|
Gross profit |
|
|
1,669,276 |
|
|
|
1,437,517 |
|
|
|
1,112,558 |
|
|
Gross margin |
|
|
36.0 |
% |
|
|
38.2 |
% |
|
|
39.2 |
% |
|
|
|
|
|
|
|
|
|
|
|
|
|
|
|
Direct-to-Consumer sales |
|
$ |
2,812,121 |
|
|
$ |
2,551,547 |
|
|
$ |
1,778,420 |
|
|
Gross profit |
|
|
1,846,081 |
|
|
|
1,686,854 |
|
|
|
1,093,240 |
|
|
Gross margin |
|
|
65.6 |
% |
|
|
66.1 |
% |
|
|
61.5 |
% |
|
|
|
|
|
|
|
|
|
|
|
|
|
|
|
Total sales |
|
$ |
7,444,550 |
|
|
$ |
6,310,187 |
|
|
$ |
4,613,430 |
|
|
Gross profit |
|
|
3,515,357 |
|
|
|
3,124,371 |
|
|
|
2,205,798 |
|
|
Gross margin |
|
|
47.2 |
% |
|
|
49.5 |
% |
|
|
47.8 |
% |
|
|
|
As of December 31, |
|
|
(in thousands) |
|
|
2022 |
|
|
|
2021 |
|
|
Identifiable assets |
|
|
|
|
|
|
|
|
|
Wholesale |
|
$ |
3,682,860 |
|
|
$ |
3,816,513 |
|
|
Direct-to-Consumer |
|
|
3,210,627 |
|
|
|
2,674,767 |
|
|
Total |
|
$ |
6,893,487 |
|
|
$ |
6,491,280 |
|
43
|
|
|
Year Ended December 31, |
|
|
(in thousands) |
|
2022 |
|
|
2021 |
|
|
2020 |
|
|
Additions to property, plant and equipment |
|
|
|
|
|
|
|
|
|
|
|
|
|
Wholesale |
|
$ |
255,311 |
|
|
$ |
245,008 |
|
|
$ |
228,448 |
|
|
Direct-to-Consumer |
|
|
103,681 |
|
|
|
64,666 |
|
|
|
81,468 |
|
|
Total |
|
$ |
358,992 |
|
|
$ |
309,674 |
|
|
$ |
309,916 |
|
Geographic Information
|
|
|
Year Ended December 31, |
|
|
(in thousands) |
|
2022 |
|
|
2021 |
|
|
2020 |
|
|
Geographic sales |
|
|
|
|
|
|
|
|
|
|
|
|
|
Domestic Wholesale |
|
$ |
1,831,642 |
|
|
$ |
1,448,339 |
|
|
$ |
1,132,425 |
|
|
Domestic Direct-to-Consumer |
|
|
1,243,511 |
|
|
|
1,115,018 |
|
|
|
786,844 |
|
|
Total domestic sales |
|
|
3,075,153 |
|
|
|
2,563,357 |
|
|
|
1,919,269 |
|
|
|
|
|
|
|
|
|
|
|
|
|
|
|
|
International Wholesale |
|
|
2,800,787 |
|
|
|
2,310,302 |
|
|
|
1,702,585 |
|
|
International Direct-to-Consumer |
|
|
1,568,610 |
|
|
|
1,436,528 |
|
|
|
991,576 |
|
|
Total international sales |
|
|
4,369,397 |
|
|
|
3,746,830 |
|
|
|
2,694,161 |
|
|
|
|
|
|
|
|
|
|
|
|
|
|
|
|
Total sales |
|
$ |
7,444,550 |
|
|
$ |
6,310,187 |
|
|
$ |
4,613,430 |
|
|
Regional Sales |
|
|
|
|
|
|
|
|
|
|
|
|
|
Americas (AMER) |
|
$ |
3,854,392 |
|
|
$ |
3,152,304 |
|
|
$ |
2,292,540 |
|
|
Europe, Middle East & Africa (EMEA) |
|
|
1,699,215 |
|
|
|
1,282,902 |
|
|
|
899,590 |
|
|
Asia Pacific (APAC) |
|
|
1,890,943 |
|
|
|
1,874,981 |
|
|
|
1,421,300 |
|
|
Total sales |
|
$ |
7,444,550 |
|
|
$ |
6,310,187 |
|
|
$ |
4,613,430 |
|
|
|
|
|
|
|
|
|
|
|
|
|
|
|
|
China sales |
|
$ |
1,062,724 |
|
|
$ |
1,247,949 |
|
|
$ |
924,482 |
|
|
|
|
As of December 31, |
|
|
(in thousands) |
|
|
2022 |
|
|
|
2021 |
|
|
Property, plant and equipment, net |
|
|
|
|
|
|
|
|
|
Domestic |
|
$ |
870,924 |
|
|
$ |
708,763 |
|
|
International |
|
|
474,446 |
|
|
|
420,146 |
|
|
Total |
|
$ |
1,345,370 |
|
|
$ |
1,128,909 |
|
|
|
|
|
|
|
|
|
|
|
|
China property plant and equipment, net |
|
$ |
264,422 |
|
|
$ |
255,421 |
|
The Company’s sales to its five largest customers accounted for approximately 9.6%, 8.6%, and 8.8% of total sales for the years ended December 31, 2022, 2021 and 2020.
Assets located outside the U.S. consist primarily of cash, accounts receivable, inventory, property, plant and equipment, and other assets. Net assets held outside the U.S. were $4.4 billion and $4.2 billion at December 31, 2022 and December 31, 2021.
The Company performs regular evaluations concerning the ability of customers to satisfy their obligations and provides for estimated doubtful accounts. Domestic accounts receivable generally do not require collateral. Foreign accounts receivable are generally collateralized by letters of credit. The Company’s additions to the provision for expected credit losses for the year ended December 31, 2022, 2021, and 2020 were $5.3 million, $3.3 million, and $18.7 million.
The Company’s accounts receivables, excluding allowances for bad debts and chargebacks, by geography are summarized as follows:
|
|
|
As of December 31, |
|
|
(in thousands) |
|
|
2022 |
|
|
|
2021 |
|
|
Domestic Accounts Receivable |
|
$ |
310,138 |
|
|
$ |
270,404 |
|
|
International Accounts Receivable |
|
|
597,621 |
|
|
|
525,073 |
|
44
The Company’s top five manufacturers produced the following:
|
|
|
Year Ended December 31, |
|
|
(percentage of total production) |
|
2022 |
|
|
|
2021 |
|
|
|
2020 |
|
|
Manufacturer #1 |
|
|
16.5 |
|
|
|
18.0 |
|
|
|
21.0 |
|
|
Manufacturer #2 |
|
|
7.0 |
|
|
|
5.3 |
|
|
|
6.2 |
|
|
Manufacturer #3 |
|
|
5.2 |
|
|
|
4.8 |
|
|
|
5.8 |
|
|
Manufacturer #4 |
|
|
5.2 |
|
|
|
4.6 |
|
|
|
4.9 |
|
|
Manufacturer #5 |
|
|
5.1 |
|
|
|
4.4 |
|
|
|
4.2 |
|
|
Total |
|
|
39.0 |
|
|
|
37.1 |
|
|
|
42.1 |
|
|
Item 9. |
Changes in and Disagreements with Accountants on Accounting and Financial Disclosure |
None.
|
Item 9A. |
Controls and Procedures |
Attached as exhibits to this annual report on Form 10-K are certifications of our Chief Executive Officer (“CEO”) and Chief Financial Officer (“CFO”), which are required in accordance with Rule 13a-14 of the Exchange Act. This “Controls and Procedures” section includes information concerning the controls and controls evaluation referred to in the certifications.
Evaluation of disclosure controls and procedures
We maintain disclosure controls and procedures that are designed to ensure that information required to be disclosed by a company in the reports that it files under the Exchange Act is recorded, processed, summarized and reported within required time periods and that such information is accumulated and communicated to allow timely decisions regarding required disclosures. As of the end of the period covered by this annual report on Form 10-K, we carried out an evaluation under the supervision and with the participation of our management, including our CEO and CFO, of the effectiveness of the design and operation of our disclosure controls and procedures pursuant to Rule 13a-15 of the Exchange Act. Based upon that evaluation, our CEO and CFO concluded that our disclosure controls and procedures are effective, at the reasonable assurance level as of such time.
Management’s Report on Internal Control Over Financial Reporting
Our management is responsible for establishing and maintaining adequate internal control over financial reporting, as such term is defined in Rule 13a-15(f) of the Exchange Act. Internal control over financial reporting includes those policies and procedures that:
|
|
(i) |
pertain to the maintenance of records that, in reasonable detail, accurately and fairly reflect the transactions and dispositions of our assets; |
|
|
(ii) |
provide reasonable assurance that transactions are recorded as necessary to permit preparation of financial statements in accordance with generally accepted accounting principles, and that our receipts and expenditures are being made only in accordance with authorizations of our management and directors; and |
|
|
(iii) |
provide reasonable assurance regarding prevention or timely detection of unauthorized acquisition, use or disposition of our assets that could have a material effect on our financial statements. |
With the participation of our management, including our CEO and CFO, we conducted an evaluation of the effectiveness of our internal control over financial reporting as of December 31, 2022, based on the framework in Internal Control – Integrated Framework (2013) issued by the Committee of Sponsoring Organizations of the Treadway Commission.
Based on our evaluation under the framework in Internal Control – Integrated Framework (2013), our management has concluded that our internal control over financial reporting is effective as of December 31, 2022.
Our independent registered public accountants, BDO USA, LLP, audited the consolidated financial statements included in this annual report on Form 10-K and have issued an attestation report on the effectiveness of our internal control over financial reporting as of December 31, 2022, which is set forth below.
45
Inherent Limitations on Effectiveness of Controls
Our management, including our CEO and CFO, does not expect that our disclosure controls or our internal control over financial reporting will prevent or detect all errors and all fraud. A control system, no matter how well designed and operated, can provide only reasonable, not absolute, assurance that the control system’s objectives will be met. The design of a control system must reflect the fact that there are resource constraints, and the benefits of controls must be considered relative to their costs. Further, because of the inherent limitations in all control systems, no evaluation of controls can provide absolute assurance that misstatements due to error or fraud will not occur or that all control issues and instances of fraud, if any, within the Company have been detected. These inherent limitations include the realities that judgments in decision-making can be faulty and that breakdowns can occur because of simple error or mistake. Controls can also be circumvented by the individual acts of some persons, by collusion of two or more people, or by management override of the controls. The design of any system of controls is based in part on certain assumptions about the likelihood of future events, and there can be no assurance that any design will succeed in achieving its stated goals under all potential future conditions. Assessments of any evaluation of controls’ effectiveness to future periods are subject to risks. Over time, controls may become inadequate because of changes in conditions or deterioration in the degree of compliance with policies or procedures. Because of the inherent limitations in a cost-effective control system, misstatements as a result of error or fraud may occur and not be detected.
Changes in internal control over financial reporting
There were no changes to our internal controls over financial reporting that have materially affected, or are reasonably likely to materially affect, our internal controls over financial reporting during the fourth quarter of 2022.
46
Report of Independent Registered Public Accounting Firm
Shareholders and Board of Directors
Skechers U.S.A., Inc.
Manhattan Beach, California
Opinion on Internal Control over Financial Reporting
We have audited Skechers U.S.A., Inc.’s (the “Company’s”) internal control over financial reporting as of December 31, 2022, based on criteria established in Internal Control – Integrated Framework (2013) issued by the Committee of Sponsoring Organizations of the Treadway Commission (the “COSO criteria”). In our opinion, the Company maintained, in all material respects, effective internal control over financial reporting as of December 31, 2022, based on the COSO criteria.
We also have audited, in accordance with the standards of the Public Company Accounting Oversight Board (United States) (“PCAOB”), the consolidated balance sheets of the Company as of December 31, 2022 and 2021, the related consolidated statements of earnings, comprehensive income, equity, and cash flows for each of the three years in the period ended December 31, 2022, and the related notes and financial statement schedule listed in the accompanying index and our report dated February 28, 2023 expressed an unqualified opinion thereon.
Basis for Opinion
The Company’s management is responsible for maintaining effective internal control over financial reporting and for its assessment of the effectiveness of internal control over financial reporting, included in the accompanying Item 9A, Management’s Report on Internal Control over Financial Reporting. Our responsibility is to express an opinion on the Company’s internal control over financial reporting based on our audit. We are a public accounting firm registered with the PCAOB and are required to be independent with respect to the Company in accordance with U.S. federal securities laws and the applicable rules and regulations of the Securities and Exchange Commission and the PCAOB.
We conducted our audit of internal control over financial reporting in accordance with the standards of the PCAOB. Those standards require that we plan and perform the audit to obtain reasonable assurance about whether effective internal control over financial reporting was maintained in all material respects. Our audit included obtaining an understanding of internal control over financial reporting, assessing the risk that a material weakness exists, and testing and evaluating the design and operating effectiveness of internal control based on the assessed risk. Our audit also included performing such other procedures as we considered necessary in the circumstances. We believe that our audit provides a reasonable basis for our opinion.
Definition and Limitations of Internal Control over Financial Reporting
A company’s internal control over financial reporting is a process designed to provide reasonable assurance regarding the reliability of financial reporting and the preparation of financial statements for external purposes in accordance with generally accepted accounting principles. A company’s internal control over financial reporting includes those policies and procedures that (1) pertain to the maintenance of records that, in reasonable detail, accurately and fairly reflect the transactions and dispositions of the assets of the company; (2) provide reasonable assurance that transactions are recorded as necessary to permit preparation of financial statements in accordance with generally accepted accounting principles, and that receipts and expenditures of the company are being made only in accordance with authorizations of management and directors of the company; and (3) provide reasonable assurance regarding prevention or timely detection of unauthorized acquisition, use, or disposition of the company’s assets that could have a material effect on the financial statements.
Because of its inherent limitations, internal control over financial reporting may not prevent or detect misstatements. Also, projections of any evaluation of effectiveness to future periods are subject to the risk that controls may become inadequate because of changes in conditions, or that the degree of compliance with the policies or procedures may deteriorate.
/s/ BDO USA, LLP
Los Angeles, California
February 28, 2023
47
|
Item 9B. |
Other Information |
None.
|
Item 9C. |
Disclosure Regarding Foreign Jurisdictions that Prevent Inspections |
Not applicable.
48
PART III
|
Item 10. |
Directors, Executive Officers and Corporate Governance |
The information required by this Item 10 is hereby incorporated by reference from our definitive proxy statement, to be filed pursuant to Regulation 14A within 120 days after the end of our 2022 fiscal year.
|
Item 11. |
Executive Compensation |
The information required by this Item 11 is hereby incorporated by reference from our definitive proxy statement, to be filed pursuant to Regulation 14A within 120 days after the end of our 2022 fiscal year.
|
Item 12. |
Security Ownership of Certain Beneficial Owners and Management and Related Stockholder Matters |
The information required by this Item 12 is hereby incorporated by reference from our definitive proxy statement, to be filed pursuant to Regulation 14A within 120 days after the end of our 2022 fiscal year.
|
Item 13. |
Certain Relationships and Related Transactions, and Director Independence |
The information required by this Item 13 is hereby incorporated by reference from our definitive proxy statement, to be filed pursuant to Regulation 14A within 120 days after the end of our 2022 fiscal year.
|
Item 14. |
Principal Accountant Fees and Services |
The information required by this Item 14 is hereby incorporated by reference from our definitive proxy statement, to be filed pursuant to Regulation 14A within 120 days after the end of our 2022 fiscal year.
49
PART IV
|
Item 15. |
Exhibit and Financial Statement Schedules |
|
1. |
Financial Statements. The financial statements as set forth under Item 8 of this Annual Report on Form 10-K are incorporated herein. |
|
2. |
Financial Statement Schedule. |
Schedule II - Valuation and Qualifying Account
|
(in thousands) |
|
Balance at
Beginning of Year |
|
|
Costs
Charged to
Expenses |
|
|
Deductions
and
Write-offs |
|
|
Balance at
End of Year |
|
|
Year-ended December 31, 2020 |
|
|
|
|
|
|
|
|
|
|
|
|
|
|
|
|
|
Allowance for chargebacks |
|
$ |
17,413 |
|
|
$ |
12,734 |
|
|
$ |
(3,473 |
) |
|
$ |
26,674 |
|
|
Allowance for doubtful accounts |
|
|
6,693 |
|
|
|
19,940 |
|
|
|
(4,745 |
) |
|
|
21,888 |
|
|
Liability for sales returns and allowances |
|
|
69,048 |
|
|
|
18,023 |
|
|
|
(9,852 |
) |
|
|
77,219 |
|
|
Reserve for inventory |
|
|
6,728 |
|
|
|
15,920 |
|
|
|
(14,428 |
) |
|
|
8,220 |
|
|
Year-ended December 31, 2021 |
|
|
|
|
|
|
|
|
|
|
|
|
|
|
|
|
|
Allowance for chargebacks |
|
$ |
26,674 |
|
|
$ |
45,957 |
|
|
$ |
(32,497 |
) |
|
$ |
40,134 |
|
|
Allowance for doubtful accounts |
|
|
21,888 |
|
|
|
10,551 |
|
|
|
(9,889 |
) |
|
|
22,550 |
|
|
Liability for sales returns and allowances |
|
|
77,219 |
|
|
|
6,263 |
|
|
|
(14,538 |
) |
|
|
68,944 |
|
|
Reserve for inventory |
|
|
8,220 |
|
|
|
24,899 |
|
|
|
(25,608 |
) |
|
|
7,511 |
|
|
Year-ended December 31, 2022 |
|
|
|
|
|
|
|
|
|
|
|
|
|
|
|
|
|
Allowance for chargebacks |
|
$ |
40,134 |
|
|
$ |
25,558 |
|
|
$ |
(29,275 |
) |
|
$ |
36,417 |
|
|
Allowance for doubtful accounts |
|
|
22,550 |
|
|
|
6,804 |
|
|
|
(6,299 |
) |
|
|
23,055 |
|
|
Liability for sales returns and allowances |
|
|
68,944 |
|
|
|
5,444 |
|
|
|
(13,906 |
) |
|
|
60,482 |
|
|
Reserve for inventory |
|
|
7,511 |
|
|
|
31,825 |
|
|
|
(21,606 |
) |
|
|
17,730 |
|
|
|
|
|
|
|
|
|
|
|
|
|
|
|
|
|
|
|
See accompanying report of independent registered public accounting firm
50
Index to Exhibits
|
|
Exhibit Number |
|
Description |
|
|
|
|
|
3.1 |
|
Amended and Restated Certificate of Incorporation dated April 29, 1999 (incorporated by reference to exhibit number 3.1 of the Registrant’s Form 10-Q for the quarter ended September 30, 2015). |
|
|
|
|
|
3.1(a) |
|
Amendment to Amended and Restated Certificate of Incorporation dated September 24, 2015 (incorporated by reference to exhibit number 3.2 of the Registrant’s Form 10-Q for the quarter ended September 30, 2015). |
|
|
|
|
|
3.2 |
|
Bylaws dated May 28, 1998 (incorporated by reference to exhibit number 3.2 of the Registrant’s Registration Statement on Form S-1 (File No. 333-60065) filed on July 29, 1998). |
|
|
|
|
|
3.2(a) |
|
Amendment to Bylaws dated as of April 8, 1999 (incorporated by reference to exhibit number 3.2(a) of the Registrant’s Form 10-K for the year ended December 31, 2005). |
|
|
|
|
|
3.2(b) |
|
Second Amendment to Bylaws dated as of December 18, 2007 (incorporated by reference to exhibit number 3.1 of the Registrant’s Form 8-K filed on December 20, 2007). |
|
|
|
|
|
3.2(c) |
|
Third Amendment to Bylaws dated as of May 15, 2019 (incorporated by reference to exhibit number 3.1 of the Registrant’s Form 8-K filed on May 17, 2019). |
|
|
|
|
|
4.1 |
|
Form of Specimen Class A Common Stock Certificate (incorporated by reference to exhibit number 4.1 of the Registrant’s Registration Statement on Form S-1, as amended (File No. 333-60065), filed on May 12, 1999). |
|
|
|
|
|
4.2 |
|
Description of Securities. |
|
|
|
|
|
10.1* |
|
Skechers U.S.A., Inc. Deferred Compensation Plan (incorporated by reference to exhibit number 10.1 of the Registrant’s Form 8-K filed on May 3, 2013). |
|
|
|
|
|
10.1(a)* |
|
First Amendment to the Skechers U.S.A., Inc. Deferred Compensation Plan (incorporated by reference to exhibit number 10.1(a) of the Registrant’s Form 10-K filed for the year ended December 31, 2020). |
|
|
|
|
|
10.2* |
|
2006 Annual Incentive Compensation Plan (incorporated by reference to Appendix A of the Registrant’s Definitive Proxy Statement filed on April 29, 2016). |
|
|
|
|
|
10.2(a)* |
|
First Amendment to the 2006 Annual Incentive Compensation Plan (incorporated by reference to Appendix B of the Registrant’s Definitive Proxy Statement filed on April 29, 2016). |
|
|
|
|
|
10.3* |
|
2017 Incentive Award Plan (incorporated by reference to Appendix A of the Registrant’s Definitive Proxy Statement filed on May 1, 2017). |
|
|
|
|
|
10.4* |
|
Form of Restricted Stock Agreement (Time-based Vesting) under 2017 Incentive Award Plan (incorporated by reference to exhibit number 10.6 of the Registrant’s Form 10-K for the year ended December 31, 2017). |
|
|
|
|
|
10.5* |
|
Form of Restricted Stock Agreement (Performance-based Vesting) under 2017 Incentive Award Plan (incorporated by reference to exhibit number 10.6 of the Registrant’s Form 10-K filed for the year ended December 31, 2020). |
|
|
|
|
|
10.6* |
|
2018 Employee Stock Purchase Plan (incorporated by reference to Appendix B of the Registrant’s Definitive Proxy Statement filed on May 1, 2017). |
|
|
|
|
|
10.7 |
|
Form of Indemnification Agreement between the Registrant and its directors and executive officers (incorporated by reference to exhibit number 10.6 of the Registrant’s Form 10-K for the year ended December 31, 1999). |
|
|
|
|
|
10.8 |
|
Registration Rights Agreement dated June 9, 1999, between the Registrant, the Greenberg Family Trust and Michael Greenberg (incorporated by reference to exhibit number 10.7 of the Registrant’s Form 10-Q for the quarter ended June 30, 1999). |
|
|
|
|
|
10.9* |
|
Tax Indemnification Agreement dated June 8, 1999, between the Registrant and certain shareholders (incorporated by reference to exhibit number 10.8 of the Registrant’s Form 10-Q for the quarter ended June 30, 1999). |
|
|
|
|
|
10.10* |
|
Employment Agreement, executed May 23, 2019, effective as of January 1, 2019, between the Registrant and Michael Greenberg (incorporated by reference to exhibit number 10.1 of the Registrant’s Form 8-K filed on May 24, 2019). |
|
|
|
|
|
10.11 |
|
Employment Agreement, executed May 23, 2019, effective as of January 1, 2019, between the Registrant and David Weinberg (incorporated by reference to exhibit 10.2 of the Registrant’s Form 8-K filed on May 24, 2019). |
51
|
|
Exhibit Number |
|
Description |
|
|
|
|
|
|
|
|
|
10.12 |
|
Amended and Restated Limited Liability Company Agreement dated April 12, 2010 between Skechers R.B., LLC, a Delaware limited liability company and wholly owned subsidiary of the Registrant, and HF Logistics I, LLC, regarding the ownership and management of the joint venture, HF Logistics-SKX, LLC, a Delaware limited liability company (incorporated by reference to exhibit number 10.11 of the Registrant’s Form 10-K for the year ended December 31, 2011). |
|
|
|
|
|
10.12(a) |
|
First Amendment to Amended and Restated Limited Liability Company Agreement dated August 11, 2015 by and between Skechers R.B., LLC, a Delaware limited liability company and wholly owned subsidiary of the Registrant, and HF Logistics I, LLC, regarding the ownership and management of the joint venture, HF Logistics-SKX, LLC, a Delaware limited liability company (incorporated by reference to exhibit number 10.1 of the Registrant’s Form 8-K filed on August 17, 2015). |
|
|
|
|
|
10.12(b) |
|
Second Amendment to Amended and Restated Limited Liability Company Agreement dated February 12, 2019 by and between Skechers R.B., LLC, a Delaware limited liability company and wholly owned subsidiary of the Registrant, and HF Logistics I, LLC, regarding the ownership and management of the joint venture, HF Logistics-SKX, LLC, a Delaware limited liability company (incorporated by reference to exhibit number 10.14(b) of the Registrant’s Form 10‑K for the year ended December 31, 2018). |
|
|
|
|
|
10.12(c) |
|
Third Amendment to Amended and Restated Limited Liability Company Agreement dated December 26, 2019 by and between Skechers R.B., LLC, a Delaware limited liability company and wholly owned subsidiary of the Registrant, and HF Logistics I, LLC, regarding the ownership and management of the joint venture, HF Logistics-SKX, LLC, a Delaware limited liability company (incorporated by reference to exhibit number 10.14(c) of the Registrant’s Form 10-K for the year ended December 31, 2019). |
|
|
|
|
|
10.13 |
|
Amended and Restated Loan Agreement dated as of August 12, 2015, by and among HF Logistics-SKX T1, LLC, which is a wholly owned subsidiary of a joint venture entered into between HF Logistics I, LLC, and Skechers R.B., LLC, a Delaware limited liability company and wholly owned subsidiary of the Registrant, Bank of America, N.A., as administrative agent and as a lender, and CIT Bank, N.A. and Raymond James Bank, N.A., as lenders (incorporated by reference to exhibit number 10.2 of the Registrant’s Form 8-K filed on August 17, 2015). |
|
|
|
|
|
10.13(a)** |
|
First Amendment to Amended and Restated Loan Agreement dated as of March 18, 2020, by and among HF Logistics-SKX T1, LLC, which is a wholly owned subsidiary of a joint venture entered into between HF Logistics I, LLC, and Skechers R.B., LLC, a Delaware limited liability company and wholly owned subsidiary of the Registrant, Bank of America, N.A., as administrative agent and as a lender, and CIT Bank, N.A. and Raymond James Bank, N.A., as lenders.(incorporated by reference to exhibit number 10.1 of the Registrant’s Form 8-K filed on March 24, 2020). |
|
|
|
|
|
10.14 |
|
China DC Loan Agreement, dated September 29, 2018, between Skechers Taicang Trading and Logistics Co Limited, a wholly owned subsidiary of Skechers China Limited, which is a joint venture of the Registrant, and China Construction Bank Corporation, regarding distribution center in Taicang, China (incorporated by reference to exhibit number 10.1 of the Registrant’s Form 10-Q (File No.001-14429) for the quarter ended September 30, 2018). |
|
|
|
|
|
10.15 |
|
Mortgage Contract, dated August 28, 2018, between Skechers Taicang Trading and Logistics Co Limited, a wholly owned subsidiary of Skechers China Limited, which is a joint venture of the Registrant, and China Construction Bank Corporation, regarding distribution center in Taicang, China (incorporated by reference to exhibit number 10.2 of the Registrant’s Form 10-Q (File No.001-14429) for the quarter ended September 30, 2018). |
|
|
|
|
|
10.16** |
|
Guarantee Agreement, dated July 24, 2018, between Skechers Taicang Trading and Logistics Co Limited, a wholly owned subsidiary of Skechers China Limited, which is a joint venture of the Registrant, and China Construction Bank Corporation, regarding distribution center in Taicang, China (incorporated by reference to exhibit number 10.3 of the Registrant’s Form 10-Q (File No.001-14429) for the quarter ended September 30, 2018). |
|
|
|
|
|
10.17 |
|
Cooperative Agreement on Close Management of Fixed Asset Loan Project, dated September 29, 2018, between Skechers Taicang Trading and Logistics Co Limited, a wholly owned subsidiary of Skechers China Limited, which is a joint venture of the Registrant, and China Construction Bank Corporation, regarding distribution center in Taicang, China. (Incorporated by reference to exhibit number 10.4 of the Registrant’s Form 10-Q (File No.001-14429) for the quarter ended September 30, 2018). |
|
|
|
|
|
|
10.18 |
|
Credit Agreement dated November 21, 2019, by and among the Registrant, and Bank of America, N.A., HSBC Bank USA, N.A., JPMorgan Chase Bank, N.A. and other lenders (incorporated by reference to exhibit number 10.1 of the Registrant’s Form 8-K filed with Securities and Exchange Commission on November 21, 2019). |
|
52
|
|
Exhibit Number |
|
Description |
|
|
|
|
|
|
|
|
|
|
10.18(a) |
|
First Amendment to Credit Agreement dated March 23, 2021, by and among the Registrant, and Bank of America, N.A., HSBC Bank USA, N.A., JPMorgan Chase Bank, N.A. and other lenders (incorporated by reference to exhibit number 10.1 of the Registrant’s Form 10-Q (File No.001-14429) for the quarter ended March 31, 2021). |
|
|
|
|
|
|
|
10.18(b) |
|
Second Amendment to Credit Agreement dated December 15, 2021, by and among the Registrant, and Bank of America, N.A., HSBC Bank USA, N.A., JPMorgan Chase Bank, N.A. and other lenders (incorporated by reference to exhibit number 10.1 of the Registrant’s Form 8-K filed with Securities and Exchange Commission on December 16, 2021). |
|
|
|
|
|
|
|
10.19 |
|
Guaranty dated November 21, 2019, by and among Skechers USA Retail, LLC, a California limited liability company and wholly owned subsidiary of the Registrant, Bank of America, N.A. and other lenders (incorporated by reference to exhibit number 10.2 of the Registrant’s Form 8-K filed with Securities and Exchange Commission on November 21, 2019). |
|
|
|
|
|
|
|
10.20 |
|
Reaffirmation Agreement dated December 15, 2021 by and among Skechers USA Retail, LLC, a California limited liability company and wholly owned subsidiary of the Registrant, and Bank of America N.A. (incorporated by reference to exhibit number 10.2 of the Registrant’s Form 8-K filed with Securities and Exchange Commission on December 16, 2021). |
|
|
|
|
|
|
|
10.21 |
|
Loan Contract, dated October 18, 2022, between Skechers Taicang Trading and Logistics Co Limited, a wholly owned subsidiary of Skechers China Limited, which is a joint venture of the Registrant, and Bank of China Co., Ltd., regarding distribution center in Taicang, China (incorporated by reference to exhibit number 10.1 of the Registrant’s Form 10-Q (File No.001-14429) for the quarter ended September 30, 2022). |
|
|
|
|
|
|
|
21.1 |
|
Subsidiaries of the Registrant. |
|
|
|
|
|
|
|
23.1 |
|
Consent of Independent Registered Public Accounting Firm. |
|
|
|
|
|
|
|
31.1 |
|
Certification of the Chief Executive Officer pursuant to Rule 13a-14(a) of the Securities Exchange Act of 1934, as amended. |
|
|
|
|
|
|
|
31.2 |
|
Certification of the Chief Financial Officer pursuant to Rule 13a-14(a) of the Securities Exchange Act of 1934, as amended. |
|
|
|
|
|
|
|
32.1*** |
|
Certification pursuant to 18 U.S.C. 1350, as adopted pursuant to Section 906 of the Sarbanes-Oxley Act of 2002. |
|
|
|
|
|
|
|
101.INS |
|
Inline XBRL Instance Document - the instance document does not appear in the Interactive Data File because its XBRL tags are embedded within the Inline XBRL document. |
|
|
|
|
|
|
|
101.SCH |
|
Inline XBRL Taxonomy Extension Schema Document. |
|
|
|
|
|
|
|
101.CAL |
|
Inline XBRL Taxonomy Extension Calculation Linkbase Document. |
|
|
|
|
|
|
|
101.DEF |
|
Inline XBRL Taxonomy Extension Definition Linkbase Document. |
|
|
|
|
|
|
|
101.LAB |
|
Inline Taxonomy Extension Label Linkbase Document. |
|
|
|
|
|
|
|
101.PRE |
|
Inline XBRL Taxonomy Extension Presentation Linkbase Document. |
|
|
|
|
|
|
|
104 |
|
Cover Page Interactive Data File (formatted as Inline XBRL and contained in Exhibit 101) |
|
|
* |
Management contract or compensatory plan or arrangement required to be filed as an exhibit. |
|
** |
Confidential treatment has been granted by the SEC with respect to certain information in the exhibit pursuant to Rule 24b-2 of the Exchange Act. Such information was omitted from the filing and filed separately with the Secretary of the SEC. |
|
*** |
In accordance with Item 601(b)(32)(ii) of Regulation S-K, this exhibit shall not be deemed “filed” for the purposes of Section 18 of the Exchange Act or otherwise subject to the liability of that section, nor shall it be deemed incorporated by reference in any filing under the Securities Act or the Exchange Act. |
|
Item 16. |
Form 10-K Summary |
None.
53
SIGNATURES
Pursuant to the requirements of Section 13 or 15(d) of the Securities Exchange Act of 1934, the Registrant has duly caused this report to be signed on its behalf by the undersigned, thereunto duly authorized, in the City of Manhattan Beach, State of California on the 28th day of February 2023.
|
|
|
SKECHERS U.S.A., INC. |
|
|
|
|
|
By: |
|
/s/ Robert Greenberg |
|
|
|
Robert Greenberg |
|
|
|
Chairman of the Board and
Chief Executive Officer |
Pursuant to the requirements of the Securities Exchange Act of 1934, this report has been signed by the following persons on behalf of the Registrant and in the capacities and on the dates indicated.
|
Signature |
|
Title |
|
Date |
|
|
|
|
|
|
|
|
|
|
|
|
|
/s/ Robert Greenberg |
|
Chairman of the Board and Chief Executive Officer |
|
February 28, 2023 |
|
Robert Greenberg |
|
(Principal Executive Officer) |
|
|
|
|
|
|
|
|
|
/s/ Michael Greenberg |
|
President and Director |
|
February 28, 2023 |
|
Michael Greenberg |
|
|
|
|
|
|
|
|
|
|
|
/s/ David Weinberg |
|
Executive Vice President, Chief Operating Officer, |
|
February 28, 2023 |
|
David Weinberg |
|
and Director |
|
|
|
|
|
|
|
|
|
/s/ John Vandemore |
|
Chief Financial Officer |
|
February 28, 2023 |
|
John Vandemore |
|
(Principal Financial and Accounting Officer) |
|
|
|
|
|
|
|
|
|
/s/ Katherine Blair |
|
Director |
|
February 28, 2023 |
|
Katherine Blair |
|
|
|
|
|
|
|
|
|
|
|
/s/ Morton D. Erlich |
|
Director |
|
February 28, 2023 |
|
Morton D. Erlich |
|
|
|
|
|
|
|
|
|
|
|
/s/ Zulema Garcia |
|
Director |
|
February 28, 2023 |
|
Zulema Garcia |
|
|
|
|
|
|
|
|
|
|
|
/s/ Yolanda Macias |
|
Director |
|
February 28, 2023 |
|
Yolanda Macias |
|
|
|
|
|
|
|
|
|
|
|
/s/ Richard Siskind |
|
Director |
|
February 28, 2023 |
|
Richard Siskind |
|
|
|
|
|
|
|
|
|
|
54